A new 101 bus map for a revised bus system

In case you missed it, Marin Transit, in partnership with Golden Gate Transit, has made some changes to Marin’s bus system. The changes to existing routes saved enough money that they were able to add about 15,000 more service-hours to the system, meaning people around the county have better transit. The changes inspired a second look at my 101 corridor bus guide, and the result is here.

101 Buses-Weekday 2013.08-x

While the guide, technically called a “strip map,” reflects the changes to bus routes, I’ve also added non-GGT and Marin Transit routes to the map. Greyhound’s once-per-day north-south Arcata-SF service, Sonoma County Transit’s express services, and Mendocino Transit Authority’s service from Fort Bragg to Santa Rosa all made it onto the map.

It’s much less Marin-centric as a result, but no detail has been lost. Instead, Sonomans can know their options, Marinites can know their options, and all users get an expansive view of where they can go by transit in the North Bay’s 101 corridor.

This is the sort of map GGT needs to have at every bus pad and every transit center along its route. I created the original 101 bus map because I couldn’t visualize how all the lines interact and work together, nor could I tell what buses served which bus pad.

My home church, for example, is located off Smith Ranch Road, so it’s off the Lucas Valley bus pad. Since the 49 is the only bus whose schedule said it stopped at Lucas Valley, I’ll probably take it, turning what should have been a 15 minute ride into a 35 minute tour of Terra Linda.

With this map, I know I can have take the 70, 71, or 80. On a weekday evening, I might take the 44. But the 49? While it does serve the bus pad, it’s a local bus serving Terra Linda and the Civic Center, so it’s not the best idea.

A pocket version will be available in the next few weeks.

Personalized mapping

Transit maps in Marin are, well, not very good. Especially for the uninitiated, they can be confusing spaghetti. About a year ago, I was contacted by a young man in Novato who had his drivers' license suspended for some reason and wanted to know how to get around to his destinations. He went to school in College of Marin, worked in Petaluma, and hung out with his friends in the East Bay. How was he supposed to get out of Novato without a car?

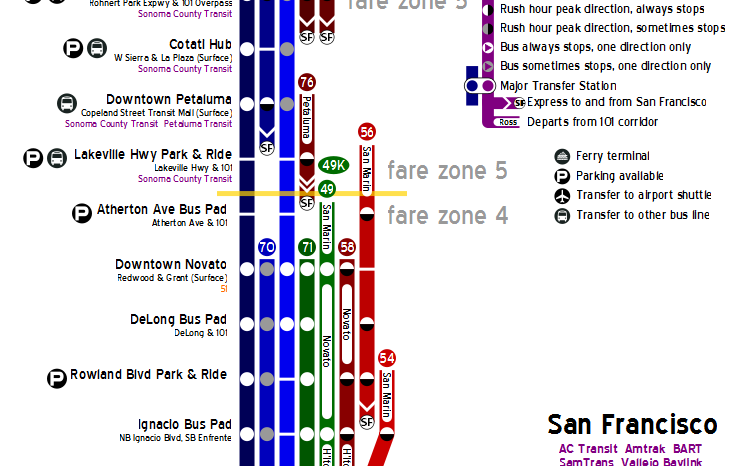
After an abortive attempt at a Novato spider map, I realized all I needed were the various connections between the destinations so he could know exactly how he could get from A to B without all the mess of geography. The map below is the result.

GGT Novato-2

It's simple, so it doesn't include things like frequency or span of service. Instead, I wanted to show how to get from place to place, major stops, and where those routes went after transfer points and destinations, without all the fuss of a more detailed map. Were I to make this again, I would probably place 49/49K to the west of the 101 corridor north of Ignacio and east of it to the south to reflect actual geography, but as it stands I think there's enough hints for the user to see where the bus goes.

I've never followed up with him to see how it went, though he seemed pretty excited to see it. Perhaps it will be of some use to you as well, as it's now up in the Map Room.

The 101 Bus Pocket Guide

By popular demand, I've reworked the Highway 101 Strip Map into a printable version and added a timetable. Print this out and stick in on your wall, shove it in your (man) purse, or gloat to friends that you actually know where you're going. Because you deserve it. If you're a bus driver, defy your superiors and put this on display where passengers can see it when doing a 101 run. Seriously, they'll thank you.

Guides like this one are extremely useful for complicated, but important, pieces of transit infrastructure. How all the routes come together to form a single bus system from top to bottom is what makes 101 the trunk line that it is. Leaving it unmapped, as GGT and Marin Transit have done, simply hides from the public how much transit is actually available to use.

Alternative Future: A Contemporary Interurban

Let's say for a minute the Interurban hadn't stopped running in 1941. It was bleeding money, but its parent company, NWP, was a for-profit entity. What if the Interurban had somehow survived?

For the sake of this exercise, I'm taking a few liberties. First, that the Bay Area had valued its rail transportation system from the 30s to the present, but had consolidated it all, as well as the Golden Gate Bridge, under the single umbrella of the MTC. Second, that European best practices had been implemented at least in this corner of the country. Third, that the Interurban could now survive on a 50% subsidy. And fourth, that Marin and Sonoma have their current populations, though with less sprawl.

Though I had originally intended for this to be a bit more a light post rather than something more data-driven, a Twitter conversation with Dan Lyke motivated me to put some numbers behind the costs of an Interurban.

Costs per vehicle-kilometer (vkm) vary widely based on the system. Vancouver's automated Skytrain system costs $2.18/vkm, BART costs around $3.50/vkm, and New York's subway costs $5.81/vkm. Using quite a few assumptions, I get an average annual operating cost between $43.2 million and $111.6 million. If we assume an average fare of $2.50 and a 50% farebox recovery rate, total ridership would need to be between 8.6 million per year, roughly the same number of transit trips on today's GGT system, and 22.3 million. With the Geary and North Beach extensions (Muni's 38-Geary alone carries over 13 million weekday passengers per year), it's entirely feasible for the system to meet BART's 80% farebox recovery.

Alas, reconstructing the system would be prohibitively expensive and politically impossible. Large portions of some major roads (Sir Francis Drake Boulevard, Fourth and Third Streets, Magnolia Avenue, Miller Avenue, and others) would need to be converted back to rail, wealthy homeowners would need to accept trains running behind their back yards, Sausalito would need to take a new elevated railway along the waterfront, Geary and North Beach would need to be torn up for a new subway, and over $10 billion would need to be spent. While the San Francisco part of the project might be worth it, for 8 million riders per year, most of them already served by transit, the cost and pain of the Marin Interurban simply wouldn't be worth it.

This map, along with all my other maps, is posted in the Map Room.

Mapping the Interurban

In 1941, the last ferry and the last train ran on the NWP Interurban commuter line, and Marin was handed over to the battle of its life against the car-centric development unleashed by the Golden Gate Bridge. Marinites, unlike most of the country, won that battle, and we maintained the transit-oriented development passed down from the age of rail. Most of us, though, don't even know what it looked like, and the best thing we've got are grainy maps and schedules from the 1930s. That's all well and good, but hides the structure and sinews of the system. The purpose of contemporary transit mapping is to combine not just where a system goes, but how and, to a lesser extent, when.

I've created two maps that do just that for the Interurban. The first is in an "old" style. Old printing techniques could only print two or three colors. Given that the Interurban shut down in 1941, I thought a map inspired by that era made sense.

The second map is the same thing, but in a "new" style. With contemporary printing techniques, we can do as many colors as we like. The advantage is that individual lines can be individually colored, snapping into focus what lines go where.

As you can see, it was quite a comprehensive system, at least for Central and Southern Marin. Northern Marin was served by intercity rail, more akin to Amtrak than BART, and was not part of the electric rail system highlighted here.

New Visual of Highway 101 Service

Marin’s bus service is centered around Highway 101 and its “trunk” routes. From commuter lines to the basic San Francisco regional lines to the supplementary local routes, getting from one place to another on Highway 101 should be an easy task. Alas, it is not. Not every bus pad is labeled on the freeway bus map with which buses stop where. Since not all buses stop at all bus pads, you don’t always know whether to take the bus or not. The first time I went by bus to the Lucas Valley pad on a Sunday morning, I tried to figure out which buses stopped there and would pick me up at the Transit Center. Not knowing that it was all printed in the front of my transit guide, I took the 49K and went on a long, 35-minute ride around Terra Linda. Had all the information been in front of me at once on a simple map, I would’ve known that the 70 and 80 would’ve taken me, no problem, but that I should avoid the 101.

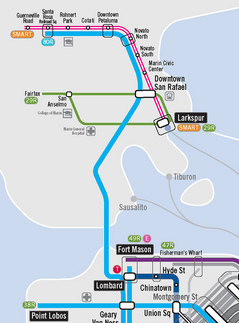
The bus map here is a strip map, a simplified diagram showing all stops and which buses stop and which stop when. Though it’s a design that could be improved upon, the map does show all routes and all stops along the 101 corridor. Ideally, the map would be paired with a Highway 101 timetable showing all bus departures. It and the schedule would be posted at every bus pad and major transit hub on the corridor, allowing every passenger to know which bus goes where.

At 41 inches long but only 10 inches wide, it could also be posted inside buses that run along the 101 corridor, allowing passengers to look at it and internalize it while riding, like how subway cars have a map of the subway posted.

Since this is a rather complicated trunk line, be sure to post corrections and comments for me. How, too, could this design be improved upon? What might make this a less confusing or more useful diagram?

On another topic, be sure to come out this Wednesday to the Flatiron, 724 B Street, San Rafael, CA, at 6pm for our third happy hour. It’ll be good times, I guarantee it.

UPDATE: I neglected to mention that Anthony Nachor of My Bay Area Ideas was instrumental in proofing things. He knows the 101 system like the back of his hand, so a hat tip to him for his help.

The New Hub Spider Map

That map I posted yesterday?  I slept on it and I realized it was hideous, so I took another whack at the info boxes and I think I've come up with a usable final version of the Hub Spider Map.  Since I'll be in town this week, the map's going up at the Hub sometime over the next few days.

Since we've already discussed spider maps, I'll leave the general subject out of this post. Suffice it to say that my map shows all the regular bus routes departing from the San Anselmo Hub.  Routes to the Hub are not included, so the 22's once-per-day meandering north through Mill Valley stays off.  The purpose is to give people an idea of where they can go from the Hub without the clutter of geography.

The principal changes in this map are:

  1. Route start/end markers.  One critique I got from the first map was the difficulty in keeping track of which color corresponds to which line.  To make it easier, I've put colored markers with the route number at each endpoint.
  2. Redesigned major stations.  The old map had large, ungainly boxes for the Hub and the San Rafael Transit Center.  To streamline the map, I converted them into elongated versions of other transfer stations elsewhere on the map.
  3. Straightened the angles.  I converted all angles to the standard 45 degrees for the sake of elegance and to make it easier on the eyes.
  4. Removed the regional transit map.  Though I'd like to have the regional transit map available, it needs to be so small on a legal-sized sheet of paper that it become illegible.  Rather than deal with an illegible map, I've taken it out entirely.
  5. Reworked the info boxes.  Scheduling, directions to other destinations, and a fare information box have all been added and moved around.  The Financial District map has also moved to give space to the scheduling box.
  6. Removed Muni transfer information.  It cluttered the San Francisco portion of the map too much, and Muni buses typically don't share stops with GGT anyway.

Though it's not the best transit map in the world, I'm certainly not a graphic designer.  In all, I feel confident that the map will help riders from the Hub to understand the system better.  I suppose we shall see.

How Fantastical Is the Fantasy?

Copyright Brian Stokle The fantasy transit map of the Bay Area I brought up on Wednesday had me thinking a fair amount about Marin's transit options.  Though we are typically the odd county out when it comes to fantasy transit improvements – though Napa certainly gets the short end of this particular map’s stick – Brian Stokle’s map adds two thoughtful improvements to the county’s transit system, and I think we’d do well to explore them, as well as a third.

I should mention that I appreciate the value of bus-only lanes to a degree, but in suburban settings it is sometimes better to mix them with three-person carpools as well.  In Northern Virginia, the casual carpool system functions as another transit system, vastly improving the efficiency of private cars and, therefore, the existing car-based infrastructure.  Mixing buses and cars isn’t always the best idea, but I think for Marin it makes perfect sense, both for political and practical reasons.

The 29R Rapid Bus

The 29R rapid bus line runs in a kind of loop between Fairfax, San Anselmo, Greenbrae, Larkspur Landing, the Canal, downtown San Rafael, Miracle Mile and finally back to the Hub, where I assume it would turn around.

Rapid bus isn’t the bus rapid transit (BRT) system that we’re used to hearing about – it doesn’t have its own lanes or stations.  Rather, the rapid bus concept functions as an express, limited stop bus with some structural changes beneath the surface, mostly to how the bus handles intersections.  These, along with high frequency (every 15 minutes, maximum), makes the bus a viable alternative against the car.  Even without the frequency improvements, adding speed to a bus line makes it less expensive to run and more attractive to potential riders.

The 29R route makes sense.  The Fairfax-San Rafael corridor is the county’s densest, and the narrow valley makes it well suited to a rapid bus line.  The Greenbrae stretch, though not nearly as dense, is an important transportation corridor, and building a rapid bus line here would serve populations that are otherwise left behind by SMART.  Greenbrae is also the kind of suburban strip that is easily converted to higher, more urbanist uses.

The drawback to a rapid bus line that it doesn’t have its own corridor.  Sir Francis Drake gets backed up during the morning rush between Fairfax and the Hub, as well as though Ross and near the Greenbrae Interchange, and a rapid bus shouldn’t be allowed to get stuck in that mire.  The same goes for Second Street in San Rafael.

To compensate, the 29R should be complemented with limited dedicated lanes.  Center, the old rail right-of-way between San Anselmo and Fairfax, might be re-purposed as a rush-hour bus and carpool lane.  It’s odd to imagine a surface street being carpool and bus only, but it would take a great deal of pressure off Sir Francis Drake and speed service along the corridor.  Yolanda and Landsdale Stations, the old light-rail stops, could be reactivated as bus stops.

Though we can’t do much about the Sir Francis Drake through Ross, the boulevard widens enough at College of Marin for dedicated lanes, though an initial segment of lanes should be built from El Portal Drive to the interchange.

The Canal’s traffic patterns are less familiar to me, but it is imperative the bus not travel the narrow streets in the neighborhood, sticking instead to the much wider and straighter roads closer to the freeway.  It’s close enough to the Canal that it will be accessible, but it will keep the bus moving fast enough to justify its “rapid” moniker.

The ultimate cost would likely be in the tens of millions, and building such a system will require more forward-thinking on development issues, but the ultimate reward would be much improved Central Marin circulation.

The 80R Bus Rapid Transit

Much more ambitious is the 80R Bus Rapid Transit (BRT) line, running from Santa Rosa to the Transbay Terminal.  Presumably, the line would have limited stop service on its own dedicated lanes for the whole trip, and would share the BRT lanes with other buses running along the corridor.  It would duplicate SMART’s service between Santa Rosa and Larkspur Landing, so I wouldn’t recommend building the line north of San Rafael.

A small portion of this line is already being built by SFMTA on Van Ness, which is getting its own dedicated lanes.  Presumably other streets will be similarly improved, but that’s just for San Francisco.  The Marin and Sonoma stretch will be extraordinarily expensive, involving rebuilt or widened freeway overpasses at minimum and possibly even new tunneling in the Marin Headlands.

The first portion of a BRT system is its dedicated lanes.  Ideally, these lanes will be permanently off-limits to private cars, and would certainly be off-limits to single-passenger only vehicles, and they would stretch along the entire length of the line.  This includes the stretch of freeway south of Marin City, which could mean some extremely expensive tunneling projects or a narrower freeway.  The Golden Gate Bridge itself would need dedicated bus lanes, which in theory would double the capacity of the bridge but would be politically challenging to build.

The other portion of a BRT system is its stops.  Like a train system, the stops would be located along the right-of-way; for the 80R, that would mean building new ramps directly between its lanes and freeway overpasses, where the BRT stations would be constructed.  Alternatively, passengers might board the bus at the freeway level in an enclosed station, and access would be provided from the street level.  These would be expensive as well, and the 80R would likely rival SMART in its costs.

Once finished, though, the system would be a transit lifeline for San Franciscans working north and North Bay residents working south.  As it stands,San Francisco’s Marin-bound buses leave only every hour or so in the morning, making transit commutes rather inconvenient.  BRT would need to run every 5-15 minutes to make the investment worthwhile, tying the City to the county in a way it has never been.

What’s Missing? BART

The missing piece is a strong connection from the Transit Center to the Richmond BART station and its Amtrak connections.  Though today the 40 and 42 buses don’t get a lot of ridership, building a rapid bus or BRT line with direct connections between San Rafael and Richmond would be a boon to Contra Costa County, one of the largest sources of Marin’s in-commuters.

A rapid bus line would start at the Transit Center and proceed along Francisco Boulevard, entering 580 at the bridge.  It would make a straight shot to the Richmond station and turn around, altogether taking 30-40 minutes.  A BRT line would run exclusively on the freeway, with its only stops being at Richmond, the Marin side of the bridge, and San Rafael.  Such a run would take about 20-30 minutes.

Though it would face the same challenges as the 29R and 80R, I like this route because it would provide easy transit between the Delta, the East Bay, and Marin while connecting Marinites with existing rail options the county doesn't have.  Given that the balance of commuting is East Bay to Marin, it might make more sense to build it as an AC Transit system, freeing Golden Gate Transit from making such a huge investment for residents outside its district.

In Sum

In sum, the two improvements, plus mine, are strong service improvements for Marin.  Other parts of Marin could use a rapid bus system similar to the 29R, especially the Mill Valley to Sausalito corridor.  Less plausible is a SMART service improvement, providing 30 minute headways all day, and even less would see the system double-tracked and electrified with 5-15 minute headways, which would likely require another ballot initiative.

Fantasy maps like Stokle’s aren’t meant to be entirely practical, of course – they’re meant to make us imagine what our cities can be like, and what they might be like if we ever get around to it transit improvements.  I’d like to see more of this – how about you?

Walkable Centers, Walkable Stations

If our local transit agencies ever revamp their bus maps or create supplements like my spider map, they should mark important stops as walkable centers, branding them like rail stations even if SMART will never go anywhere near them. Inspired by David Klion's metro station walkability rankings for the DC area I decided to make my own.  I was curious how our various bus pads and transit hubs stack up against one another in part out of curiosity, and in part to see whether major improvements could be made around our town centers and bus pads.  Using Walkscore, I got the following rankings, in order:

  1. Santa Rosa Town Center, 98
  2. Mill Valley Town Center, 97
  3. Fairfax Parkade, 95
  4. San Rafael Transit Center, 94
  5. Copeland Street, Petaluma, 94
  6. Terra Linda Bus Pad, 86
  7. Larkspur Town Center, 83
  8. San Anselmo Hub, 82
  9. Sausalito Ferry, 82
  10. Rohnert Park, Town Center, 82
  11. Ignacio Bus Pad, 80
  12. Cotati Town Center, 80
  13. Tiburon Town Center, 78
  14. Strawberry Transit Center, 75
  15. Novato Transit Center, 75
  16. Marin City Transit Center, 75
  17. Rowland Avenue Bus Pad, 74
  18. Lucas Valley Bus Pad, 74
  19. Corte Madera Town Center, 72
  20. Civic Center, 72
  21. Paradise Drive Bus Pad, 71
  22. Larkspur Landing, 71
  23. Ross Town Center, 69
  24. Delong Bus Pad, 68
  25. Lucky Drive Bus Pad, 68
  26. Tiburon Wye Bus Pad, 68
  27. Canal (Average), 67
  28. Seminary Drive Bus Pad, 66
  29. College of Marin 63
  30. Manzanita Bus Pad, 60
  31. N San Pedro Road Bus Pad, 58
  32. Spencer Avenue Bus Pad, 55
  33. Atherton Bus Pad, 51
  34. Alameda del Prado Bus Pad, 34
  35. Marinwood Bus Pad, 18
  36. Manor, 12

A few things stick out to me.  First, bus pads are far less walkable than town centers, though most of them are walkably close to amenities.  Especially surprising was the Lucas Valley bus pad, which is within walking distance of quite a few commercial outlets.  It is apparently more accessible than bus stops in downtown Ross and Corte Madera.  Second is the high accessibility of older towns and low accessibility of newer areas.  Third is that Marin's development is remarkably walkable compared to that of the DC metro area.  The average score for Marin is just a hair under 71, the same as DC's subway station average of 71, though some of the suburban counties have averages in the 40s. Lastly, there is no stop in Marin with a perfect 100.

One should keep in mind that Walkscore doesn't include the actual pedestrian environment. I'd much rather spend an afternoon in downtown Corte Madera than around the Smith Ranch Road office parks. Rather, Walkscore tells us that the bones of a real, metro-esque system are already in place, and that these neighborhoods, if retrofitted for walkability and served properly by transit, could take off.  It also tells us that development and the bus system have gone hand-in-hand: the various walkable (or at least accessible) centers around the county are served by the bus.

And these are the places that should be branded as transit hubs.  In DC, unlike the Bay Area, metro stations are the centers of a huge amount of development.  Cities market their metro stations as potential downtowns, and conversations about urban planning, office development, and more revolve around transit accessibility.  DC's metro map makes it easy for people to know how to get where they want to go, and businesses can market themselves with ease.  The carless Washingtonian may never get on the bus, but they know how to get where they need to go if it's next to a Metro station.

The same sort of branding and mapping could bring investment to the various gray fields around our bus hubs.  The Hub, for example, has an abandoned construction project not more than 500 feet away.  It's built into the hillside, so a taller building of four stories or more is certainly feasible.  Something similar might be built around Smith Ranch Road on either side of the freeway, while the huge parking lots around downtown Tiburon and Larkspur Landing could be put to far better use than car storage.

Because these centers are already walkable, they could in theory support more transit than is currently in place.  Marin's buses are blessed with walkable areas and mostly simple routes.  They just need that push to succeed.

Bringing the Spider Map Home

The greatest problem with bus lines is that nobody knows where they go.  While light rail or streetcar tracks are not for every route, they do let people visually understand where transit goes.  Buses, however, travel along the same roadways as cars, leaving drivers in the dark as to where they go.  Communicating a route properly is extremely important to pulling back the veil of our transit system, and for showing people how transit is freedom from the car.

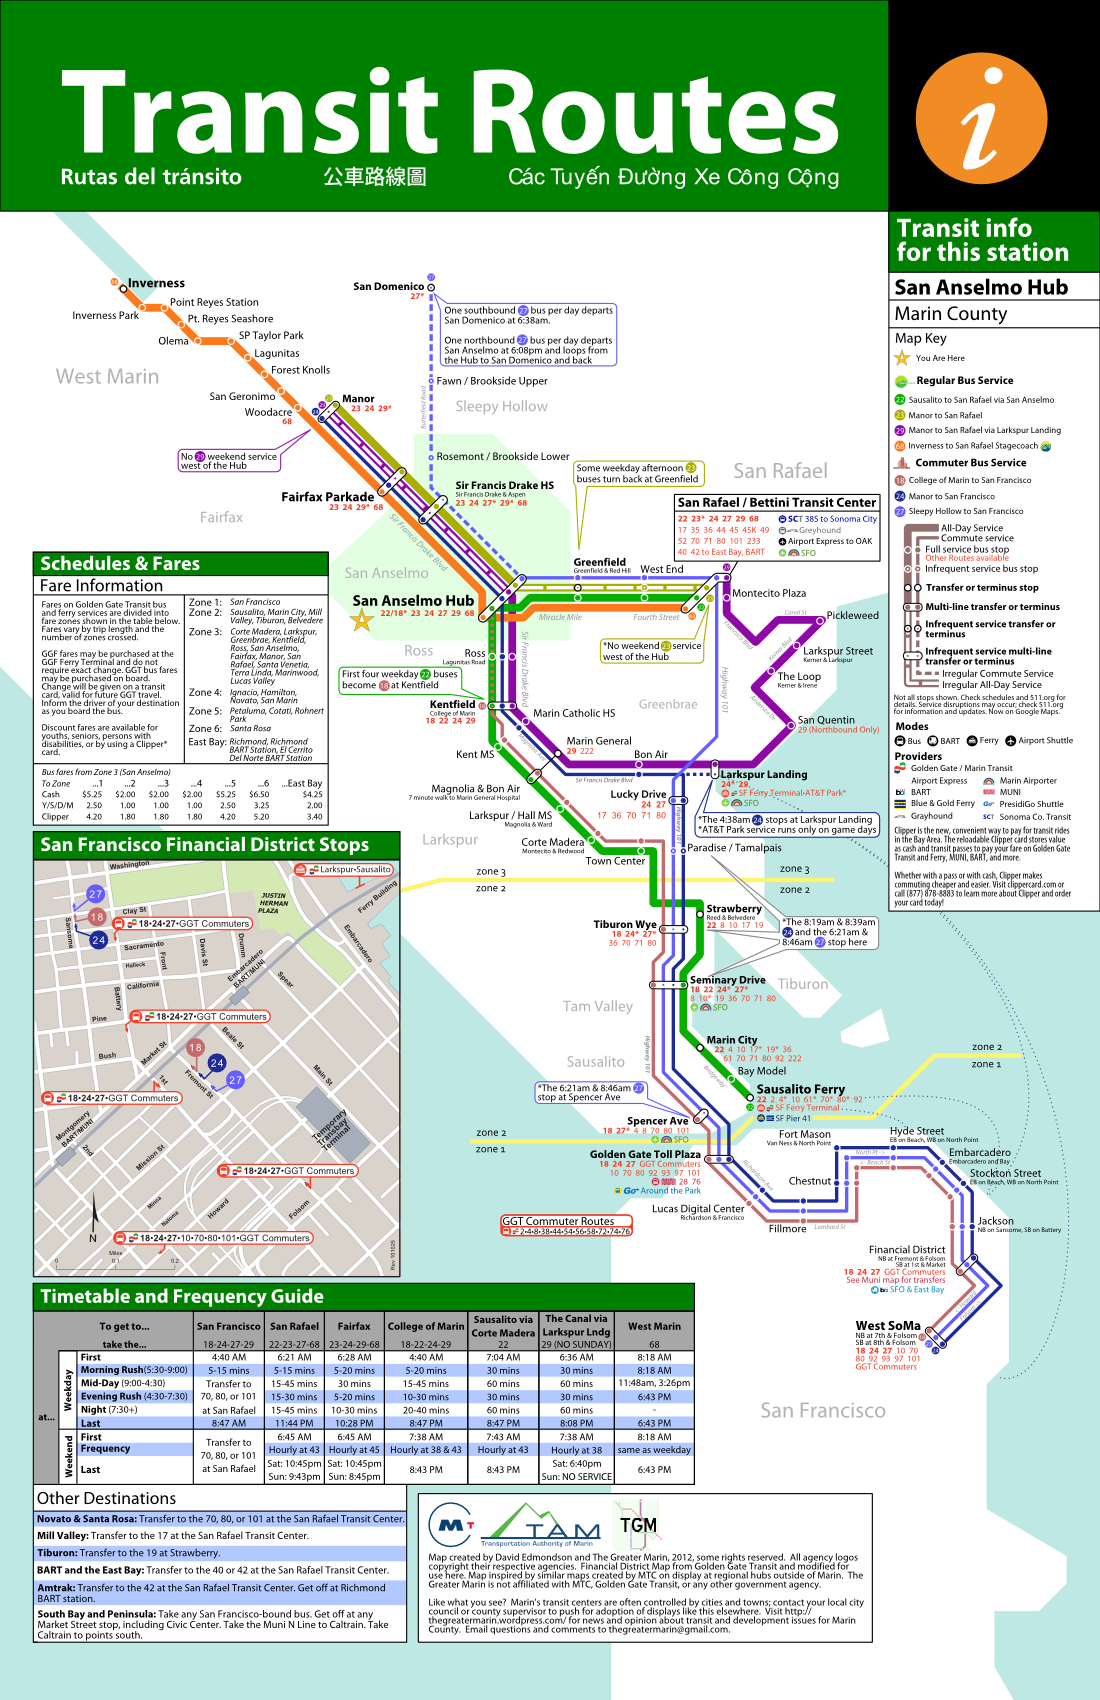
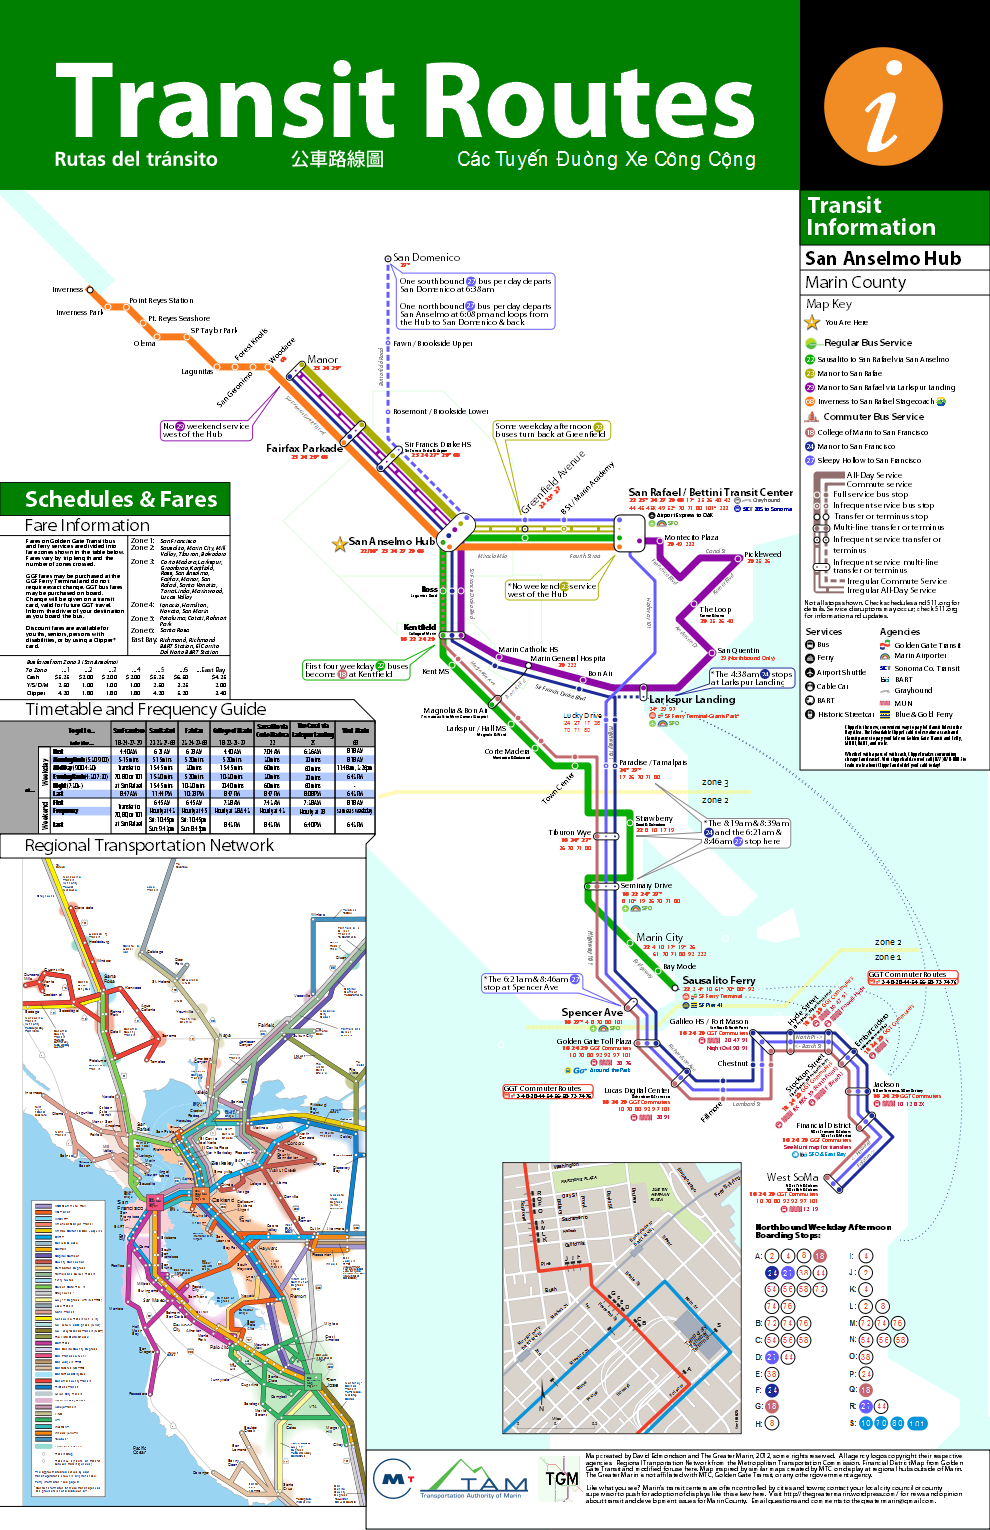
To address this problem in at least one corner of Marin, I've designed a draft spider map for the San Anselmo Hub (PDF).  We discussed spider maps previously; in short they are schematics of where buses intersecting a certain point run.  Such diagrams are used most successfully in London where they integrate with Tube stations, although DC has made some forays into this field of late by putting bus line schematics at bus stops and huge Transit Information Displays, or TIDs, in their metro stations.  (If anyone can find me a PDF of those TIDs, I'll be forever grateful.)  The point is to simplify a bus map by pulling out any unnecessary clutter and isolating just the bus routes, showing where riders can go without transferring.  It is, at least to some degree, a map of the freedom available to you from a given point.

My Hub spider map don't show all the stops, as those can change.  Rather, the map shows primary stops that are unlikely to change, such as Marin General Hospital.  The route lines and stop circles are displayed differently depending on levels of service to give riders a clear visual of where they can always go and where they may need to check a schedule.

As people generally don't care what service they use to go from point A to B, I included all possible transfers along with easily-identifiable logos at all stops where applicable.  This is best seen at the San Rafael Transit Center, which has transfers to all over the North Bay. Transfers in San Francisco, such as connections to the Cable Car, may be valuable to families that want to spend a weekday as tourists in the City.  Including such data also helps riders start to build a mental map of transit beyond Marin, adding connection points to knit them all together.  Plus, it provides advertising for the other agencies.  I had  never bothered to take the bus to the Oakland Airport, but now I know I can.  If I want to take a bus to the City of Sonoma, I know I can take the 38S, even if I don't know when.  The regional transit network map is intended to be an aid in that process.

Giving people a destination-based frequency guide shows riders how they could go from A to B.  If I'm in San Anselmo and I want to get to San Rafael, I don't care if it's I take the 23 or the 22.  The two lines complement one another along that corridor, and the frequency table reflects that.  Given space restrictions I did not include a full-fledged timetable, but I'm assuming other signage is nearby.  Timetables will still be necessary, as this map is for outbound trips only; the 22 doesn't always leave from Sausalito and once per weekday winds through Mill Valley on its way north, but never does going south.  These inbound trips are not visualized, and could confuse travelers.

The rest of the design is taken from MTC's TIDs (PDF), which are sadly missing in Marin.  The orange i logo, the headers, the green were added to visually identify this map with those more common maps.  A San Franciscan visiting San Anselmo would instantly recognize the visual vocabulary, knitting together in their mind that the Hub is still part of the regional transit network even if MUNI doesn't run buses there, and a San Anselmoan would feel a similar sense of recognition when leaving the county.

I chose to map the Hub mostly because I know San Anselmo best, but also because of the location's flexibility.  With some modifications it could be adapted for use up and down Ross Valley.  Used in conjunction with broader system maps and timetables, it would be a powerful tool for Marinites.

Since it's a draft, I'd appreciate any comments and criticisms.  You should know that I added a small border around the map, which is why things look a bit more squished inward than they otherwise ought.  If you think it's good enough as it is, feel free to print (and laminate!) a copy and put it at the Hub.  If you do, send me a picture: thegreatermarin [at] gmail.com.  I designed it on tabloid-sized paper, less than half the size of a traditional TID, so you can print it out without much hassle.

What do you think?  What TIDs and maps should come standard at any Marin transit hub?

Mid-Week Links: Good Times

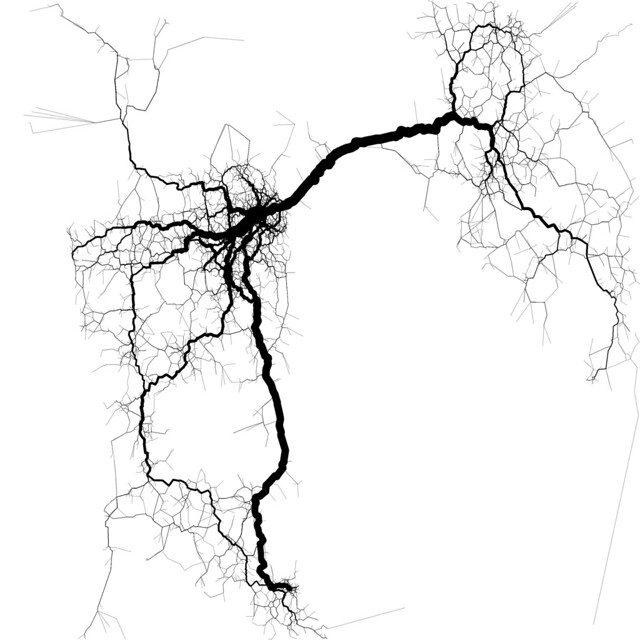
10000 trips through 10000 points Local techno/transit geek Eric Fischer wrote a program to approximate travel routes from geotagged Twitter posts, revealing the desire lines of area.  Looks like he forgot Marin is there, but apparently we don't have a whole lot of Twits to track anyway.

Marin

  • Glad that's over with: The RepealSMART effort failed to meet its minimum signature requirements and will not be on the next ballot.  This frees SMART to use $171 million it had in escrow, although the effort may return for November. (Press Democrat)
  • Then again...: Whistlestop has filed suit against SMART over the loss of its parking spaces and the effective loss of its building.  SMART and San Rafael are reportedly willing to strike a deal to solve the problem, but there are no details yet. (IJ)
  • Novato will give up its affordable housing oversight role to Marin Housing Authority, as it cannot afford the administrative costs without redevelopment funds. (IJ)
  • Today, Novato will unveil a model of its new downtown offices, which are proceeding despite newly-elected Councilmember Eric Lucan's opposition. (IJ)
  • The Marin History Museum has received an anonymous 1 to 1, $50,000 matching gift pledge to restore the Boyd House.  If you care at all about Marin's history, and about San Rafael's old housing stock, this is your time to donate. (IJ)
  • The Muir Woods Shuttle, aka the 66 bus, is slated for a fare hike, but the exact details aren't known yet.  A $5 round-trip fare, complete with bus day pass, is the likely outcome. (IJ)
  • SMART and California High-Speed Rail are getting their knocks, sometimes deservedly so, but they're nothing new: BART faced similar criticism before it opened, and Marin lost out as a result. (IJ)
  • Marin will upgrade its library lobbies into "market places" for its most popular material. I've always figured, though - if Border's died because people treated it like a library with a coffee shop, why not get coffee shops in the libraries? (IJ)
  • San Quentin, currently zoned for 1,500 new homes, could get "priority status" in order to deflect ABAG mandates elsewhere in Marin.  It doesn't change the fact that adding 1,500 homes at San Quentin is, to put it mildly, a little daft. (IJ)
  • Marin tweaked its zoning rules, adding an exemption from affordable housing requirements for some unincorporated communities, including Strawberry. Other changes were made to permitting and smart growth planning areas. (Pacific Sun)
  • Sausalito will include some of their harbor docks as affordable housing in their Draft Housing Element, as live-aboards pay significantly less rent than their land-lubbing fellow Sausalitans. (IJ)

The Greater Marin

  • Windsor has approved their downtown station-area plan, although they won't see any train service until after 2015. (Press Democrat)
  • The House and Senate are moving forward with their respective Transportation Reauthorization bills.  Activists, including myself,  aren't so keen on the House version. (The Hill, Streetsblog)
  • Nationally, the number of renters has grown significantly, while the number of homeowners has declined, meaning cities are likely well-equipped for the demand.  (Atlantic Cities)
  • The BART extension to Livermore is giving voice to an existential question facing the system: should it expand ever outward, or should it keep what it already has?
  • Mountain View rejected bus rapid transit because it would have taken up left-turn lanes.  This is a step back for the city's efforts to put moving people, not cars, first.

And...: A beautiful new subway in Kazakhstan. (Architizer)... One Bay Area falls flat in San Ramon, too. (San Ramon Express)... Stockton Street survived just fine without any parking for a week. (Streetsblog)

Maximizing Golden Gate Transit: Headways Schmeadways

I remember reading about a Fairfax woman that decided to go car-free in Marin.  To do it, she sat down each night, mapped out her route and carefully wrote down the times, transfers, and locations for each of the buses.  When she borrowed a friend’s car because of a particularly hectic day, she felt "like a bird flying over her homeland" as she was finally free of the bus schedule. Call me naïve, but I think this means Golden Gate Transit has a problem.

Mapping Frequency

Buses lack the walk-up quality inherent in a car or subway system if headways are longer than about 15 minutes.  Headways longer than that force passengers to memorize the schedule and adapt their lives to the bus, rendering the bus a significantly less attractive mode.

Not all bus corridors are like this, but you wouldn’t know it by looking at a bus map.  While a street map indicates the priority of its roadways through different line colors and weights – highways as thick and red, arterials as less thick and yellow, and local streets as thin and gray – bus maps typically show all lines and all corridors as equal.  While there is a hierarchy in the bus system of which corridors are more or less important, that information is hidden from the rider.  There is nothing to distinguish the tangle of lines from one another.

Human Transit has strongly advocated for frequency maps for larger cities, which highlight routes or corridors with headways that meet or exceed a certain threshold, typically 12 minutes.  Examples are SF Cityscape's frequency map of San Francisco, Washington, DC's draft 15-minute bus map, and Los Angeles' published 15-minute bus map.  GGT’s bus lines rarely see consistent headways better than 30 minutes, but even showing which corridors combine for 30 minute intervals would be a fabulous improvement.  Another possibility is to emulate Vancouver, which publishes a frequent bus map highlighting peak hour routes.  This is where the bulk of GGT's transit ridership lies, and would be useful to capture more of that share.

Either map type would be an improvement over the current map, which shows transit operator.  Riders don’t need to know who operates the bus, only that it takes them where they need to go.

When's the NextBus?

Unlike other regional agencies, GGT doesn’t share its real-time data with 511.org and doesn’t use NextBus despite the fact that it uses GPS to track where its buses are.  This is odd, to say the least, as opening up its location data and utilizing NextBus would be incredibly fruitful for the agency.  Its buses have such long headways that missing the bus could mean an hour’s delay.  If the bus is a little early and the rider is a little late, it’s a missed connection that could mean a blown appointment or a missed pickup at school.

Showing when the next bus will come and not just when it’s scheduled to come frees the business man or the parent from that worry.  Applications and devices utilizing similar data are common elsewhere.  The typical use is directly feeding the data to the rider through websites, smartphone apps and a call-in service, and some systems use them at high-traffic transit centers.  There are more innovative uses as well.  In Chicago, the open data is used for displays in shops and cafes near bus stops, allowing riders to shop, relax or keep out of the rain while keeping an eye on the arrivals.

This last use would be especially helpful for the long headways.  Little is more frustrating or annoying than feeling trapped at a bus stop waiting for your ride.  Shop displays capture the rider for business and allow the rider to do more than just sit around and wait.

Publicizing the bus arrival times opens up the bus system to casual users.  If I need to get to Fourth Street later that day and I see that a bus is going there in 7 minutes, I know I can hop a ride and be there without dealing with parking.  It embeds the fact that buses are a viable transportation option into the collective mind and bypasses scheduling entirely.

Frequency maps accomplish the same thing in a system-wide way, giving riders an idea of the priority given to bus corridors and routes far from where they normally travel or currently are.  It widens the mental map from two points (home bus stop to San Francisco bus stop) to the whole network, demystifying the system and rendering it useful for casual use.

Longer-term, shorter headways facilitated by and facilitating denser infill development around the various transit centers would provide a much more seamless experience with the bus.  As it stands, headways of an hour makes GGT a system of last resort.  There's only so much marketing can do to help counter the inherent structural flaws of the system, but maximizing what we have requires it.  Lifting the black veil that covers GGT would be a boon to the system and, by extension, to Marin’s sustainability and livability.

Maximizing Golden Gate Transit: Wayfinding from A to B

Marin isn’t known as a transit-oriented place, despite its deep green ideology.  While fewer than 45% of San Franciscans drive alone to work, a full 74% of Marinites do.  In other places, low transit ridership is due in part to the opaque nature of bus routes and schedules, and GGT is certainly opaque.  What might it do to become more transparent?

The first problem is one of bus routes.  Many riders, if they don’t know a bus route, don’t know where they’ll end up if they board the bus.  Unlike a rail-based system, riders can’t look at the rails and see where they go.  Only specialized knowledge, gleaned from studying the bus map or utilizing wayfinding tools like 511.org, would allow an inexperienced user to utilize the bus system by feel.

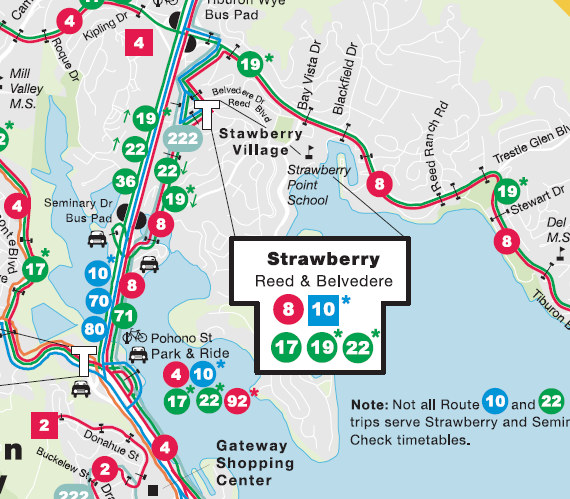
Transit centers present a special difficulty because of the plethora of options.  If I want to go from Sausalito to the Seminary Drive bus pad, I first need to check to see what bus numbers depart from Sausalito, then what routes look like they might serve Seminary Drive.  The 70 and 80 have asterisks next to them so I don’t know if they’ll come by Sausalito.  The 10 might, too, but it also has an asterisk that says it might not serve Seminary.  The 22 probably does, but getting back I might need to get on someplace else because it looks as though it veers off someplace near… Forget it, I’m taking the cab.

This should not be so hard!  I look at maps like this every day in a much more complicated bus network and this confused me.  Any route that hits Seminary Drive from Sausalito doesn’t even always make it to Sausalito or Seminary Drive.  I only know this because of side notes that say, “Check timetables.”  On top of that, there isn’t an easy way to say that every X minutes a bus departs Sausalito for Seminary Drive.

What if I don’t want to go to Seminary Drive but want to see where I can go from Sausalito?  I’d know the end points but not the stops in between without studying the map to find the small numbers and make sure the tiny color lines match up with the numbers’ coloring.  Knowing where to go has turned from easy to highly technical, and this is only a small transit center; San Rafael would be significantly worse.

Without dramatically altering the routes to be more consistent, good graphic design can help lower the barriers to bus usage significantly.  One of the best ways to address wayfinding is what is known as a “spider map”, a concept widely used in London’s bus system.  It takes the jumbled mess of bus lines near a Tube station and charts them out to their ends, with major stops marked.

It does this in a cartogram, rather than a geographic map.  By removing the geographic data and showing only the most important stops, the map can most effectively highlight the most useful service data.  Differing line colors or patterns show visually the various exceptions to the rules, such as partial or peak-only service, and general trends of service, such as which “trunk” the line goes along or bus headway.  This grants the bus system the same clarity as a subway system and visually associates the lowly bus with the ease and comfort of rapid transit.

Making buses work for casual riders is a perennial problem.  Even here in Washington, DC, I know many people that live here months or years without ever boarding a bus.  Understanding the bus system is seen as Deep Knowledge of the system’s otherwise impenetrable black box.  Yet in Marin, the bus is our only mass transit option.  It is imperfect, but it is comprehensive, and converting a driver to the bus will require it to be much more than the confusing map of seemingly random lines it currently is.

This addresses casually knowing how to get someplace, but knowing when to show up for your bus is still a problem, one we’ll address next week.