Unless something major happens at the Association of Bay Area Governments (ABAG), San Anselmo will likely need to build around 833 new homes between now and 2030, increasing its housing stock by almost 16 percent. While rezoning single-family zones and seeing new apartments have caused major heartburn in other towns, San Anselmo actually has a wealth of space to fit it all in without the fuss – if it’s willing to dig into its past for the solution.
Read More227 homes proposed for downtown Novato
The proposed 227 homes for downtown Novato would be the first in the city to invoke SB 35, the controversial legislation that allows for buildings that meeting objective criteria to be built without significant review from localities. This proposal would absolutely be worthwhile - if it qualifies.
Read MoreOvercrowding and COVID-19 in Marin
Does COVID-19 mean America needs to abandon density and decamp to the suburbs? Hardly - the problem is with overcrowded apartments, not dense streets. In Marin, that means San Rafael’s Canal neighborhood, where 30 percent of homes are far too crowded, is especially vulnerable.
Read MoreNew San Rafael apartment proposal illustrates how things shouldn’t suck
Image from Russell Architects.
San Rafael could soon be home to 180 new apartments in Terra Linda [1]. Located on a grassy lot above Los Gamos and Highway 101 and about halfway between the Freitas and Smith Ranch exits, the site is an excellent illustration of how close Terra Linda is to being a great place and the kinds of interventions it needs.
The plan
The apartments will be 20 percent affordable, per city ordinance, and the development will include 30 studios (each 492 square feet), 60 1-bedrooms (each 750 square feet), 75 2-bedrooms (also 750 square feet), 15 3-bedrooms (907 square feet) and 270 parking spaces [2] (a parking-to-home ratio of 1.5, which isn’t bad).
It will also include a common area and market, a playground, walking trails, and exercise equipment. All of this will be perched on the side of a hill separating Las Gallinas from Los Gamos. Given its proximity to the freeway, and that sound generally travels uphill, the buildings are planned to be built with sound-dampening windows and materials.
Outlined in yellow is the site. Image generated from MarinMap.org
Assessment
From a site-plan standpoint, I only have a few nitpicks. The architecture looks like a ski lodge rather than a Mission-revival architecture that I think would better fit the hillside. A more tree-focused landscaping plan would better shield residents from pollution and noise. Paths should come down on either side of Building 2 so people from the upper tier can easily access the lower tier on foot. Exterior parking should be parallel instead of perpendicular to better protect sidewalks and create a more enclosed feel for those walking around the site.
The site plan. Image from Russell Architects.
But the context? That’s where Terra Linda’s urban design sins continue to cause pain.
Terra Linda was built as a regional shopping destination, with an indoor mall, two strip malls, and office space galore, wrapped in a gooey layer of single-family homes and car-oriented apartments and shot through with major roads. The result, of course, is a wasteland of parking lots and traffic sewers, little walking, and tons of stuff in a relatively small space, not to mention impossibly inefficient bus routes.
The Los Gamos project is just a half-mile from Northgate One and its grocery store and amenities, but to get there someone needs to walk along two unpleasant roads (Los Gamos and Freitas Parkway) and through two parking lots. To get to anywhere else in Terra Linda is to step into an area that is actively hostile to your presence anywhere outside of a vehicle. As a result, any building here will lead to far more driving than a similarly-sized project would in a less hostile location.

Typical crossing in Terra Linda, this one of Las Gallinas and Freitas Parkway. Notice the prohibition on crossing in the bottom-left of the image. Image from Google Street View.
Buses don’t run along Los Gamos – and they shouldn’t, as there is very little there – but they do run on Highway 101. However, bus pads are just as far from this site as Safeway, making them of minimal usefulness to future residents, especially given that the hostile environment will make any walk feel further than it is, especially in the summer.

Slip lanes in Terra Linda. Image from Google Street View.
San Rafael doesn’t need a big planning process to improve Los Gamos. A two-way protected bike lane along the whole stretch of Los Gamos, from Lucas Valley Road to Freitas, would go a long way to improving access. Parallel parking exists on both sides of the road but is lightly used, so removing one side shouldn’t cause hardship. Street trees and improved intersections on Freitas would go far, too, especially removing the slip lanes that allow drivers to speed around corners.
Terra Linda doesn’t need to be awful, and this site could be a benefit. But it’s up to the city, not the developer, to make this place great.
Works Cited
[1] Perra, Matthew. “Terra Linda Hillside Proposed for 180 Apartments.” Marin Independent Journal. December 29, 2019.
[2] Russell Architects. “The Neighborhood at Los Gamos,” November 20, 2019.
A not-so-SMART schedule

Just a little off-center.
Special for The Greater Marin by Martha Lauren.
It's happening. The SMART train is set to open its much-anticipated Larkspur extension next month, finally closing the gap between the train and the San Francisco Ferry – or at least, narrowing it to a slightly-too-long interchange walk next to some parking lots, lest we forget that we're in America.
At the same time, Novato is to gain a new station adjacent to its compact downtown, where it ought to have been in the first place [1]. Service northwards to Downtown Windsor and the new station at Corona Road in the North of Petaluma are planned for 2021.
Last week a presentation was given to the SMART Board of Directors, outlining the new schedule planned alongside these changes. It allows for the additional calls and a modest increase in service from 34 to 38 trips per day, plus ten trains on weekends and holidays.
There is reason to temper any excitement, however. An examination of the proposed schedule [2] reveals a number of compromises built-in.
Late to rise, early to bed
Firstly, early morning southbound service appears to be eliminated, with service beginning at 6:01 am rather than the present 4:19 am. Last trains remain disappointingly early.
It's unclear why. There may be an intention to start two trains out from Novato in the morning, which would make some sense in terms of maximizing efficiency and recruiting staff from a wider area.
But the evening schedule shows Southbound service ending early and all trains ending up back at the Northern end of the line. So either in the morning or the evening, trains must run out of service into Larkspur.
This no doubt saves a few minutes of staff time, but is ridership really so lacking that operating trains in service isn't worthwhile? That would seem surprising in light of the newly convenient ferry connections to San Francisco.
The 32-minute schedule
Another major compromise built into the schedule is that the present 30-minute peak headway becomes every 32 minutes. This is contrary to best practice across the world, where clock-face schedules are favored.
Clock-face schedules see departures at the same minutes past each hour. This means a memorable schedule that allows riders to always know the next departure, and that each trip sees the same convenient transfers with connecting routes.
Last week's presentation clearly emphasizes integration with other modes – the ferries and their 30-minute peak headway, regional buses like GGT route 40 to El Cerrito with its 30-minute peak and hourly off-peak headways, and local buses across the network. A 32-minute headway means either mediocre connections or imposing an irregular schedule on every transit route in the region.
This was all well understood when SMART was built, with a 30-minute frequency built into the infrastructure. The passing sidings were placed 13-14 minutes apart so that a Northbound and a Southbound train could, in turn, clear each single track segment in just under 30 minutes.
However, with the additional station stops in Novato and Petaluma adding about two minutes each to journey times, it becomes difficult to maintain the schedule as it stands.
Staying on the Clockface
So there is considerable value in maintaining a 30-minute schedule in order to maintain convenient regional connections. Ideally, SMART could ensure that trains are dispatched promptly, and squeeze out the performance required to maintain 30-minute headways reliably.
Failing that, another compromise is seen across legacy lines in the UK where clock face schedules were introduced. As needed, relatively low ridership stations would see only alternate trains calling. For each train that calls the one in the opposite direction skips, and they, in turn, clear the track segment in the necessary time.
Having conducted a rough analysis of distances, speed limits timings on the route, I found the current schedule is fairly tight south of Petaluma, so making an additional call in Novato is indeed a challenge. North of Petaluma, where line speeds are higher, there appears to be a little more slack in the schedule, provided trains perform reasonably well at reaching 79mph speeds.
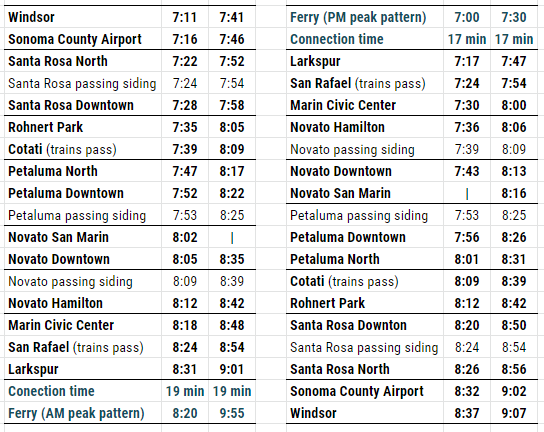
As such, the best-case 30-minute schedule would see alternate trains skip one stop in Novato. San Marin station is the obvious candidate, having much less within walking distance than the downtown station. The other half would make the stop, but then have priority passing through the siding at Petaluma, yielding a 30-minute pattern like this:
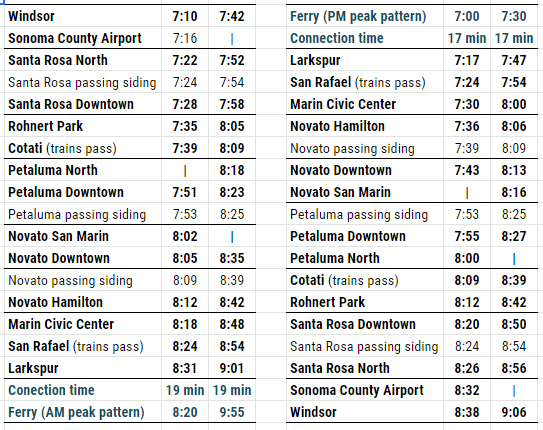
Should trains have trouble keeping schedules in Petaluma and/or Windsor, it may be necessary to further introduce hourly service to Petaluma North and/or Sonoma County Airport. In the latter case, riders could board the first train that comes and ride through Windsor if necessary. This would yield a 30-minute pattern like this:
Similar patterns could be applied to hourly service at off-peak times, with some two-hourly calls, should such service be implemented.
Note that the same pattern used both AM and PM would yield good connections with ferries at Larkspur in the peak direction, without ferries and trains drifting apart in two-minute increments.
The 64-to-30 minute schedule
Though some service gaps are eliminated, some in the morning peak remain as 64-minute gaps. While four trains in service are promised over the current six, in fact, the sixth unit only comes out for one evening return trip, leaving the morning service one train short.
This may well relate to the perennial difficulty in recruiting staff [2]. But it is a considerable inconvenience to riders and will undermine the assurance that a train is always coming soon (at least at peak times).
In the mid-day, large gaps are proposed, nominally for maintenance. Such is unusual, with modern regional railroads aspiring to at least hourly midday and evening trains. This is accomplished by undertaking light maintenance in gaps between trains, heavier maintenance at night, and major works during the occasional full weekend shutdowns.
Towards a more regular train service
Granted, many of the issues outlined here relate particular challenges, like the difficulty of recruiting blue-collar workers in an expensive region and the single track infrastructure.
Nevertheless, it is of great importance that Sonoma and Marin remain on the path to a high-quality regional transit system. This means operating as efficiently as possible now, but also keeping the aspiration for a regular regional train service in mind, and doing everything possible to achieve it.
That includes a clockface schedule in which additional trains can easily be inserted when resources become available. Such as that sixth train in the morning schedule or an hourly mid-day service.
It also includes integrating infrastructure and schedule planning. Consideration of more stations should take place alongside consideration of how to maintain service, with measures such as longer passing sidings and improved speeds. Or in the longer term, extensive double-tracking and/or electric trains, the superior acceleration of which permits more stops in a given trip time.
At best, the train can be the engine of its own success. Regular transit service, combined with planning measures that allow housing for various incomes close to stations, can create the sort of growing and diverse regional economy that attracts both riders and the workers required to serve them.
Works Cited
[1] Edmondson, David. ‘Downtown Novato Is a Better Place for a Train Station’. The Greater Marin (blog), 8 September 2015.
[2] Houston. ‘SMART Pitches New Train Schedules, Announces Larkspur Opening’. Marin Independent Journal. 21 November 2019.
[3] Prado, Mark. ‘North Bay Housing Costs Have SMART Scrambling for Engineers’. Marin Independent Journal. 23 July 2016.
[Image] Maurer, Jim. 20180114_3389.jpg. 14 January 2018. Photo.
Marin grants $20 million to bad projects around the county

More of this, I guess
Last Monday, the Transportation Authority of Marin (TAM) released $20.2 million in funds for planning and construction of road projects around the county [1]. The funds come from Measure A and Measure AA, a pair of sales tax measures with funding dedicated to transportation. If you were to only read the strategy document for Measure AA [2] and TAM’s Strategic Vision Plan [3], you would guess they’d go predominantly to road repairs and strengthening the bike and transit networks in Marin. You’d guess wrong.
Here are the three big-ticket items.
Sir Francis Drake
TAM has wanted to reconfigure Sir Francis Drake Boulevard from Ross to Highway 101 for years. Along this stretch, lanes are weird, sometimes as wide as 16 feet, and the sidewalks are narrow or nonexistent. During commute hours, the intersections along the route are quite congested, around Level of Service E or F, and bike access along the corridor is nonexistent.
The plan is to add a third lane southbound by narrowing the existing lanes, widen the sidewalks, remove the dangerous slip lanes at various corners, repaint some crosswalks, and do a bunch of miscellaneous pipe and streetlight work for a total of $22.9 million. All of this is good, but there is plenty of bad.
First, there isn’t accommodation for protected bike infrastructure anywhere along the route. TAM’s planner for the project told me it was due to the preponderance of driveways, especially in Kentfield, but that isn’t a good answer given the lack of driveways on the north side of Drake from Wolfe Grade to 101. Putting a two-way protected bike lane on the north side of Drake has its own problems, but there wasn’t even an attempt.
Second, there are a bunch of three-legged crosswalks, where people on foot can cross between three of the four pairs of corners, like so:
By my count, every major intersection has this problem. These mean that someone getting off a bus and needing to reach the diagonal corner will need to wait through 2 light cycles rather than 1, exposing them to more traffic, fumes, and delaying their trip for up to 2 minutes. Given that a typical rush-hour driver is delayed just 3 minutes today [4], it seems foolish to delay people on foot by a similar amount of time for want of some paint.
The project was awarded $11.9 million.
Novato Boulevard
Novato wants to redesign its self-titled boulevard to accommodate more traffic, estimating that the road will decline from level of service B (no traffic ever) to level of service C (heavy traffic at rush hour but no delays) level of service D (heavy traffic with mild delays) to level of service F (stop-and-go) by 2043 [5]. As recently as 2014, the road was operating with no delays (level of service B) [6], so the fast decline in service could simply be temporary or easily diverted. Rather than go with the 5-lane alternative, which would have actually widened the already-bloated road and destroyed six houses, Novato has chosen a 3-lane alternative, which still takes some property but doesn’t add capacity to the street. While better than the 5-lane version, this remains a bad plan.
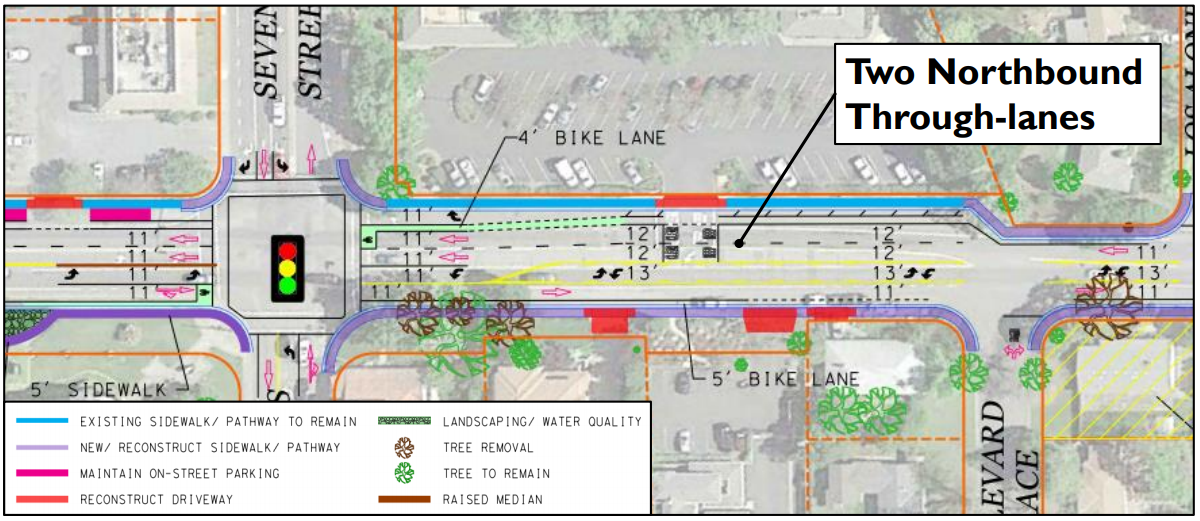
Image from the City of Novato.
I looked at Novato Boulevard as an example of an obese street a few years back [7]. Novato Boulevard has no traffic problems today and actually has capacity to spare. But instead of looking at future level-of-service, I came up with a proposal to right-size the street: eliminate the center turn lane, narrow the traffic lanes to 10 feet, widen the sidewalks and planting strips, and, of course, add protected bike infrastructure. Novato’s preferred plan does none of that, instead keeping 5-foot wide painted bike lanes (which are absolutely inappropriate on a major road) and a 13-foot-wide center turn lane – wider than a freeway lane. And remember, it’s extremely rare for this street to have any traffic whatsoever.
Somehow, this pointless project got another $1 million.
Highway 101 to I-580 Connector
One of the perennial headaches of Marin’s freeway system is going from northbound 101 to eastbound 580. Right now, drivers need to exit 101 onto a surface street – Bellam – before merging back onto 580, causing rush-hour backups. Caltrans and TAM want to fix this by building a new interchange, at a cost of up to $265 million, to allow drivers to stay on the freeway.
There are two problems with this approach. The first is that TAM staff showed back in early 2016 that the intersection with Bellam can be upgraded to a level of service C – meaning you’ll need to wait just one light cycle – and eliminate the backup onto 101 entirely with a small widening and reconfiguration [8]. It’s not necessary to build a whole new interchange or ramp.
The second issue is that if the goal is to ease commuters going between the East Bay and southern Marin (or vice versa), the real slowdowns happen elsewhere. In Marin, it’s at Westbound 580 to southbound 101, which involves a much more complicated route through surface streets, a transfer that the ramp project wouldn’t ease. In the East Bay, the westbound backup approaching the bridge’s toll plaza regularly stretches back for three miles and take up to 40 minutes to get through. Helping this would mean switching to electronic toll collection, not a new ramp in Marin.
In short, TAM is putting $6 million towards an essentially useless quarter-billion-dollar project. On the plus side, it will do little to promote driving given that it’ll do so little to speed driving. But Marin has other priorities that need funding, and $6 million can buy a lot of protected bike infrastructure.
What about environmentalism?
These projects are all about driving and cars, but Marin’s transportation problems are all about bikes, transit, and carpooling. The county’s priorities should be:
Make Marin County a world-class biking county, rivalling The Netherlands in bike safety and access.
Make buses faster, with bus-only lanes from Santa Rosa to the SF Transit Center, working with SCTA and SFMTA to make it happen through the neighboring counties.
Make buses cheaper, cutting regional fares by at least 20 percent and funding free transfers between the agencies Golden Gate Transit operates around.
Listening to TAM, they talk a good game about environmentalism and multimodalism. I doubt any of its board members or planning staff would argue that the climate is changing or that humans are to blame. But if we are to judge character based on actions rather than words, TAM has shown itself to be just as unconcerned about climate change as a coal baron. Each of these projects further entrenches car culture and driving into the collective consciousness of Marin, shirking our responsibility as environmentalists to “act local” in stopping the destruction of our planet.
An old adage is, “Where your money is, there your heart will be also.” If so, then Marin’s heart is asphalt and oil.
Works Cited
[1] Will Houston, ‘Marin Transportation Agency Allocates $20M for Projects’, Marin Independent Journal, 9 July 2019.
[2] Transportation Authority of Marin, ‘Transportation Sales Tax Measure AA Strategic Plan’ (San Rafael, CA: Transportation Authority of Marin, 30 May 2019).
[3] Transportation Authority of Marin, ‘Getting Around Marin: Strategic Vision Plan’, Draft (San Rafael, CA: Transportation Authority of Marin, 2017).
[4] LSA, ‘CEQA Environmental Impact Report: Sir Francis Drake Boulevard Rehabilitation Project’ (Point Richmond, CA: Transportation Authority of Marin, March 2018).
[5] City of Novato, ‘Novato Boulevard Improvements’ (Novato, CA: City of Novato, June 12, 2018).
[6] City of Novato, “Existing Conditions Report” (Novato, CA: City of Novato, April 1, 2014).
[7] Edmondson, David. ‘What to Do with a Road That’s Too Wide.’ The Greater Marin, December 12, 2017.
[8] Transportation Authority of Marin, ‘Access Routes from US‐101 to the Richmond San Rafael Bridge’ (28 January 2016).
Header Image: Popov, Alexander. Car, Transportation, Vehicle and Automobile. Digital Photograph. unsplash. Accessed 17 July 2019.

West End project should be approved
San Rafael has a history of blended neighborhoods. From Gerstle Park to West End, single-family homes intersperse with offices, shops, and apartments, making them neighborhoods truly for everyone. A proposal for 1628 Fifth Avenue would continue that tradition – despite a bad zoning code.
Read More
Sir Francis Drake and Saunders. Image from Google Streetview, May, 2018.
Sir Francis Drake isn't safe. What to do?
Last week, two kids were almost hit and killed by a driver on Sir Francis Drake Boulevard in San Anselmo, saved only by an alert driver and their own reactions. What might be done to make Drake safer now and in the future?
Read More
Transit Center by Egan Snow, on Flickr. Used under SS BY-SA 2.0 license.
Options and more options for the new San Rafael Transit Center
Thanks to a century’s worth of bad regulations, the Bettini Transit Center in downtown San Rafael needs to be rebuilt so SMART can get to the Larkspur Ferry Terminal. The transit center is the busiest transit hub in the North Bay and forms the lynchpin of service in Marin. Getting it right, therefore, is critical, and GGT has four options its considering to do so.
Read More
The planned new space. Looks nice, but where's the tree?
San Rafael may experiment with a less walkable downtown
San Rafael may tear up some of its downtown street trees for the sake of flowers and drivers. This is not a good plan.
Read MoreWhat to do with a road that's too wide
Novato Boulevard is far wider than it needs to be. What to do?
Read MoreTime to shake up voting in Marin
With San Rafael seemingly on the edge of enacting council districts, now is a good time to reassess how elections work in Marin. Districts are a good step, but other reforms – especially ranked-choice voting – would make the process more equitable in every election.
Read MoreRounding up Tuesday's results
Last night was a big win for Democrats throughout the country, with wins in Maine, Virginia, New Jersey, and elsewhere around the country. In Marin, 20 nonpartisan seats to community service district (CSD) boards and municipal councils were up for grabs. How the seats went says a lot about where the county is going - and what kind of people Marinites are becoming.
Read MoreThe Canal's parking shortage is not just a parking shortage
Earlier this year, San Rafael released its report [1] on parking demand in east San Rafael and found it sorely lacking. There were far too many cars for the space available, leading to overflow into other neighborhoods and constant frustration for its residents. Yet while the report detailed significant outreach and study of the problem, the recommendation for more parking was sadly lacking. Without a discussion of demand management with car sharing schemes or new bike infrastructure, the report could only go so far.
Read MoreHow Marin could make the most of its bike dollars
As the historic home of mountain biking the California Wheelmen, and Safe Routes to School, Marin has a unique place in America’s cycling history. Despite that, the number of Marinites biking to work remains quite low and its roads are hardly bike-friendly. What does the research say makes biking more attractive? And how could Marin translate this research into its projects, policies, and priorities?
Read MoreHow to add strategy to TAM's Strategic Vision Plan
Friday is the last day to comment on the Transportation Authority of Marin’s (TAM’s) draft Strategic Vision Plan. Billed as the planning framework of the agency, the document falls far short of its aims, serving more as an extended mission statement than a reliable strategy or roadmap.
Read MoreSome of Central Marin's zoning and general plan areas. These might actually be worth a damn someday. Image from MarinMaps.
California to Marin: Follow your code
Update: If you think Marin could do more to support affordable housing, contact Marc Levine and tell him you support Senate Bill 35, which this post is about, and Senate Bill 2, a package that would provide a permanent stream of funding to fight homelessness in California.
There’s no doubt that the San Francisco Bay Area is in a crisis: there are too many jobs, too many employees, and not enough housing to fit them all. Among other things, it is a massive drain on the economy, cutting national wages by somewhere around $9,000 per year on average [1]. Yet rather than taking up the responsibility laid before us, Marin and other communities around the Bay Area have chosen to shirk their responsibility to build homes for the region’s most in-need. The state looks like it has had enough obstruction, however, and will start to force cities to live up to their zoning codes. Under Senate Bill 35, cities that fail to live up to their Regional Housing Needs Allocation (RHNA) obligation will need to approve new housing that meets their zoning codes.
What does SB35 do?
In a nutshell, cities have a choice: either meet their RHNA obligations through whatever means they deem fit or allow developments that meet city rules to go through. The bill will allow for public and design feedback, but the design review board, planning commission, and town council cannot reject a project unless it violates a specific section of that city’s zoning or planning guidelines.
This kind of process is called by-right development. When someone purchases land, they have a right to do with it what they want within the boundaries of city law without needing to meet the unwritten rules that often come out in public processes. It is common for projects to be halted because of they are “too dense” or “too tall,” even if that density or height is allowed under the existing zoning. Under SB35, cities that don’t meet RHNA will not be able to stop those projects, at least not for those reasons.
To ensure density or height is whatever the community actually wants, the city will need to change their zoning code to reflect those densities or heights, ensuring a developer knows going into the project what is okay and what is not.
The only code not left in place by the SB35 are parking requirements. If a development is proposed under this law and is within a half-mile of public transit (no quality of that transit is mentioned), the city can’t impose a parking minimum. If it’s beyond that half-mile radius, a city can’t require more than one parking space per new unit.
Regarding CEQA, SB35 calls development proposals in places under the SB35 process “ministerial,” then goes on to define that ministerial process. For CEQA, actions classified as “ministerial” are important, as they are not subject to CEQA review. However, it is unclear in the Legislative Analyst’s report whether these developments are only ministerial as far as SB35 are concerned or if there are ministerial as far as the corpus of California law is concerned. If it is the former, then CEQA would still apply. If the latter, then CEQA would not [2].
For a developer, having a clearly-written development code written down would be a game-changer. It would allow investors to know at the outset how many homes can be built here or there, and what the likelihood of success really is. The fact is that the region has a critical shortage of housing is a crisis, and it is hurting the region, state, country, and even the planet by suppressing innovation and preventing the creation of billions of dollars in new wages [3].
Spotswood got everything wrong
Dick Spotswood, in his latest piece, rails against the legislation [4]. He calls it a threat to liberty, a back-door way to densify Marin. His article got just about everything wrong about the legislation – indeed, it was borderline journalistic malpractice to publish a piece, even an opinion piece, with such a tenuous grip on the facts – so it’s a good place to start on the myths.
“SB 35 uses an entirely different geographical term to define communities subject to fast-track, by-right rules fostering high-density housing. Instead of applying the rules to ‘urban’ communities, Wiener’s criteria is that if even a village is an ‘urban cluster,’ then rules encouraging big-time development without pesky environmental review are applied.”
First, SB35 defines communities subject to by-right development as those which did not meet their RHNA requirements and says developments that qualify for the by-right designation need to be somewhere (an urban cluster), not in the middle of nowhere.
Second, this definition won’t reclassify rural or suburban places as “urban” for the sake of RHNA’s density requirement of 20 or 30 units per acre, as Spotswood seems to think.
Third, the only “big-time,” “high-density” development allowed would be those allowed under a town’s existing development rules. You won’t end up with dozens of Wincup-style developments unless the city already allows them.
“It wouldn’t be as bad if Wiener’s San Francisco wasn’t hypocritical when it comes to addressing the so-called ‘housing crisis.’ High-rise condos and apartments belong in job centers like San Francisco with comprehensive public transit networks.”
Here, Spotswood tells San Francisco, “You started it!” and expects that to be a valid reason for Marin to do nothing. That’s hogwash. Marin has been a horrible offender when it comes to adding housing for its own workforce, adding 17 times more jobs than homes in the past 7 years [5]. It’s a myth that Marin primarily sends workers to San Francisco, as more people commute into Marin than commute from it [6].
Further, it shirks the responsibility Marin has for its own workforce. Sure, the county couldn’t possibly absorb all the need, but Marin is one of the region’s minnows, nor is it the only one to be affected by SB35. Every town, city, and county in California would be subject to the law, so San Francisco would be even more on the hook – with its more permissive zoning codes – than would Marin’s towns.
Second, nowhere in Marin allows high-rises. Even downtown San Rafael has a 3- to 5-story height limit, hardly towers.
Third, Marin does have a comprehensive transit network in Marin Transit and Golden Gate Transit; it just doesn’t run as frequently as we would want because there isn’t the population density to support such a network. Deepening the system should be one of Marin’s goals for the future, as should other measures that would encourage travel by means other than driving. More homes, when coupled with a better transit system to serve them, keeps traffic stable [7].
“What’s good for Marin ought to be good for the city’s cherished people-scaled neighborhoods [like the Castro and Telegraph Hill].”
The irony of Spotswood’s argument is that these City neighborhoods are the neighborhoods we should want to keep, but they are illegal under Marin’s existing planning and building codes. They are at least 30 units per acre but often go up to 40 or 50. Shared walls generally aren’t allowed in the county, and neither is the kind of commercial/residential blend that makes much of San Francisco livable. High parking minimums of 1.5 spaces per home, coupled with a ban on tandem parking, means that what could be a great front yard needs to be a wide garage door instead. Not only that, but these neighborhoods were built long before the public process choked out much new housing in The City and region.
Given that SB35 keeps much of the planning and zoning codes intact, however, we won’t see much new growth of this kind of home.
Follow your code
If Marin and other places around the state want to keep going as they have, they are welcome to do so, but they will be forced to adhere to the letters of their own law. If they want to avoid the difficulty of writing down the laws they really want, then they need to figure out how to meet their RHNA goals. Those are the choices that SB35 will give communities. Doing nothing – or as good as nothing – will no longer be an option.
Works Cited
[IMG] MarinMap. MarinMap Map Viewer, 2017.
[1] Ronald Bailey, “Zoning Laws in New York, San Francisco, and San Jose Cut Americans’ Wages by $8,775,” Reason.com, Hit & Run, (May 25, 2017).
[2] Scott Wiener, “Planning and Zoning: Affordable Housing: Streamlined Approval Process,” California Senate Bill 35 (2017).
[3] Chang-Tai Hsieh and Enrico Moretti, “Housing Constraints and Spatial Misallocation,” NBER Working Paper (National Bureau of Economic Research, May 2015).
[4] Dick Spotswood, “Lawmaker’s Proposal to Extend ‘urban’ Zoning in Marin,” Marin Independent Journal, August 22, 2017, sec. Opinion.
[5] David Edmondson, “Ten Homes Is Not Enough,” The Greater Marin, August 7, 2017.
[6] Edmondson, “Marin’s Towns Are Destinations,” The Greater Marin, June 3, 2013.
[7] Canaan Merchant, “As Arlington Booms, Traffic Drops,” Greater Greater Washington, September 30, 2014.
Ten homes is not enough
This past week, the IJ trumpeted 10 new affordable homes built in Novato, calling it “proof that Marin has room for affordable housing.” [1] These homes, which took 5 years to build, are undoubtedly welcome for their new owners, but the editorial makes a mockery of Marin’s housing crisis and the depth of the county’s need.
Over the past 7 years, Marin added about 785 homes – an increase of about 0.7 percent. [2] This might be impressive if it weren’t far outstripped by population growth of 4.4 percent, [3] six times faster than housing stock, or even more outstripped by jobs growth of 12.2 percent, [4] 17 times faster than housing stock.

Image by the author.
In that context, a 10-home project is impressive mostly because it increases Marin’s pitifully meager annual housing production by 10 percent, but it is a drop in the bucket compared to the crisis-level shortfall Marin is facing today.
If housing construction kept pace with job growth – never mind the regional housing need – the county would have added over 13,000 new homes, almost 2,000 per year. With inclusionary zoning, that would mean 400 affordable homes every year, not a mere 10 every 5 years.
This is a pace of construction that Marin is unlikely to ever meet, but it shows the sheer size of the hole we’re in. Marin doesn’t just need a few more homes; it either needs to increase its construction pace by an order of magnitude (or take active steps to hurt its economy and stop the creation of new jobs).
Celebrating the opening of 10 homes is great, and the work done by Habitat for Humanity is bold. But until we get to where this sort of opening is small potatoes, it’s like celebrating your D-average: nice, but also kind of sad.
Works cited
[1] Marin Independent Journal, “Proof That Marin Has Room for Affordable Housing,” Marin Independent Journal, July 31, 2017, sec. Opinion.
[2] US Census Bureau, “Building Permits Survey” (Washington, DC: US Census Bureau), accessed August 6, 2017.
[3] Ibid.
[4] Center for Economic Studies, “Quarterly Workforce Indicators” (Washington, DC: US Census Bureau), accessed August 6, 2017.
Valley to Valley: linking SMART and regional rail
The dream of urbanites across the central Bay Area, as they gaze out towards the golden hills of the Marin Headlands, is BART. They share that dream with the suburbanites who stare back at the picturesque view of San Francisco. That it didn’t happen is now simply a fact of life in the Bay, but we need not live with this fact.
Two weeks ago, I tackled the science of traffic congestion: why it happens and the damage it does to our transportation system [1]. Last week, I examined the best way to cope with congestion – an anti-congestion toll – and how to craft anti-congestion policies with an eye toward equity in Marin [2].
Yet an anti-congestion tolling plan works best when there are effective alternatives. Golden Gate Bus is, when it doesn’t face traffic, a fast and efficient mode of transportation. Unfortunately, it doesn’t run often and it runs into traffic frequently, especially within The City. As well, transfers between it and other long-distance transportation systems like BART and Caltrain are poor at best. Marin and Sonoma residents, then, don’t have viable alternatives to driving if their destination isn’t downtown San Francisco.
The plan in a nutshell
SMART South, as I call this plan to differentiate it from the SMART that is currently under construction, consists of the completion of the SMART system, the upgrades needed to operate at eight trains per hour per direction, and the upgrades, construction, and new trains needed to run SMART south to San Francisco and as a subway under Geary Boulevard.
This will include electrification of the existing line ($125 million [3] for 39 miles of track), pushing SMART north to Healdsburg and south to Marin City ($537 million [i] for 40 miles of surface track), rebuilding the Alto Tunnel ($60 million [4]), tunneling from Marin City to the Golden Gate Bridge ($850 million [ii] for 1.7 miles of tunnel), retrofitting the bridge ($392 million [5]), tunneling from there to the Geary Boulevard Subway ($1,365 million [ii] for 2.7 miles; the Geary Subway segment would be built separately from this project) adding passing track to the existing and new surface line to allow for higher frequency ($705 million [i] for 52 miles), elevating the downtown San Rafael track ($93 million [ii] for 0.6 miles of track), finishing the bike path from Marin City to Cloverdale ($5 million [i]), adding the Corte Madera/Larkspur, Mill Valley, Marin City/Sausalito, Vista Point, and Presidio stations ($500 million [ii]), and buying Caltrain-compatible bi-level electric trains to allow for a much and more frequent longer line ($654 million [6] for 38 3-car trains). There are also $250 million in miscellaneous costs associated with finishing the SMART line as promised. In total, this comes to about $5.5 billion for an effectively-new 85-mile system or about $65 million per mile. That’s quite a steal for American construction costs.
Passengers would be able to transfer at Union Square to BART and Muni’s under-construction Central Subway, and at the Transbay Terminal to Caltrain and high-speed rail. Depending on how the second transbay tube is built, passengers would be able to move on either to downtown Oakland or south to the Oakland Airport and Fremont without transferring.
Funding
The short of it is that anti-congestion charges on the Richmond-San Rafael Bridge (RSRB), Golden Gate Bridge (GGB) and the Novato Narrows could be leveraged into $1.4 billion [iii]. A 0.4% sales tax in Sonoma, Marin, and San Francisco could be leveraged into another $1.3 billion [iv], for a total of $2.7 billion raised locally. Regional, state, and federal monies cover about half the cost of major transit construction projects in California, and that’s the balance of the project. Ongoing operations & maintenance would be covered by fares, tolls, and sales tax income as well as state and federal support. The gritty details of all this, including a speculative financing plan and how to calculate anti-congestion tolls, will be in an upcoming post for the people who are truly interested.
Ridership
SMART South as envisioned would be built alongside a secondary transbay project extending Caltrain and some kind of heavy rail subway across the bay to Alameda County. These would happen regardless of SMART South, so its value is really in connecting the North Bay with the South and East. How many riders would use that link?
Last year, I examined what higher frequencies could do for the base SMART system’s ridership and arrived at a conservative 12,100 daily trips. Adding the southern Marin, downtown Novato, and Presidio stations would push the ridership up to 22,000 using the same model [7].
Using 2014 Census data, it appears that roughly 7,500 people live within a half-mile of SMART and SMART South stations and work within a half-mile of BART or Caltrain, or vice-versa [8]. While only half of them are likely to commute via transit after this extension, additional riders would come from outside the half-mile radius, and commutes only account for about 20 percent of all trips. Wrap all that up and we have another 50,000-80,000 trips per day, depending on fares, travel time, and transfers. Given that this range comes from a model that assumes no anti-congestion tolls - and that such tolls boost transit use – I’d lean more towards the higher than the lower number. That would nearly double the capacity of the Golden Gate and northern Highway 101 corridor.
Wrap-up
So for about $5.5 billion, paid for with new tolls and a 0.4% sales tax, SMART could dip south into San Francisco, fully tying Sonoma and Marin into the regional and statewide rail systems. It would provide a viable alternative to the freeway. Alongside tolling, it would make congestion a thing of the past in the North Bay, making deliveries more timely and commutes much more reliable.
This is merely a draft, of course, and should be subjected to more rigorous study. The political difficulties of yet another sales tax and yet-higher tolls are apparent. But SMART South is eminently attainable. With a little ingenuity and a little optimism about the future, it could be our next stop.
Footnotes
[i] Estimate from existing SMART costs.
[ii] Estimate from a variety of peer projects.
[iii] Assuming borrowing is on the same terms as MTC’s toll-related bonds and is spaced according to construction needs.
[iv] Assuming borrowing is on the same terms as SMART’s sales-tax backed bonds.
Works Cited
[1] David Edmondson, “The Science of Traffic and Its Awfulness,” The Greater Marin, July 3, 2017.
[2] David Edmondson, “Let’s Get into the Weeds: A Congestion Charge Plan for Marin,” The Greater Marin, July 10, 2017.
[3] Stephen A. Gazillo, “A Planner’s Guide to Fixed Guideway Electrification Projects,” Transportation Planning, November 2005.
[4] County of Marin, “Investigative Study to Begin on Alto Tunnel” (County of Marin, January 10, 2017).
[5] Charles Seim, Mark Ketchum, and T.Y. Lin International, “Golden Gate Bridge Mass Transit Feasibility Study” (San Francisco, CA: Golden Gate Bridge, Highway and Transportation District, October 1990).
[6] Railway Gazette, “Caltrain Signs Double-Deck EMU and Electrification Contracts,” Railway Gazette, August 16, 2016.
[7] Transportation Research Board, “Elements Needed to Create High Ridership Transit Systems,” Transit Cooperative Research Program (Washington, DC: Federal Transit Administration, March 2007).
[8] Center for Economic Studies, “Longitudinal Employer-Household Dynamics” (Washington, DC: United States Census, 2014).
Let’s get into the weeds: a congestion charge plan for Marin
Last week, we discussed how tolling designed to eliminate congestion would improve travel times and improve the efficiency of our roads. [1] This week, we get a bit into the weeds about how such a plan would work.
How to eliminate congestion in the North Bay
Marin has four main entrances, three of which have significant rush-hour congestion: the Novato Narrows, Highway 37, the Richmond-San Rafael Bridge (RSRB), and the Golden Gate Bridge (GGB), with Highway 37 being the odd one out of the congestion game.* These congested gateways are a drain on people’s time and public resources. The Narrows is only moving 85 percent of the vehicles per hour that it could, the RSRB moves just 61 percent, and the GGB moves just 74 percent capacity.**
The entrances are all chokepoints, with few or no parallel routes, so they are ideal for tolling. The toll need to be charged both directions, so existing tolls on the GGB and RSRB would be cut in half: half heading inbound and half outbound.
A toll that eliminates congestion would allow another 4,380 vehicles per hour to move at rush hour, a staggering 35 percent increase over today's numbers.
To determine the exact amount a congestion toll ought to be, we need some pieces of information: the maximum number of vehicles per hour each road can move, also known as their flow rate; the existing flow at peak hour; the amount of demand there is at peak hours; how long the flow is congested; the length of the congestion; and the median income of the area. If all of this is known, then a little calculus is needed and then, voilà, the result. Unfortunately, with publicly available data it is very difficult to determine demand, so we need to work a little bit harder for a less precise number.
I wanted to find out how much extra time people were spending in traffic than they would if all the roads were at their maximum flow and how much that lost time is worth. Tie these elements together and we get some estimates. The Narrows needs a charge of about $5 ($108 extra per month), the RSRB needs $5 on top of its existing toll (, and the GGB needs $6 on top of its existing toll. Combined, these tolls would bring in an additional $102.4 million per year, which could be used to secure bonds of up to $1.3 billion (over 30 years at a 4 percent interest rate). For context, the Golden Gate Bridge brought in $129.5 million in toll revenue in the 2015/2016 fiscal year. [2]
Look regional
Because Marin’s transit system is part of a broader regional system of bridges and highways, any tolling plan would need to be regional in order to ensure that traffic doesn’t spill over onto some other road. As previously mentioned, Marin’s entrances have very few good roads and therefore can be fairly easily tolled. However, if Marin manages to unclog its traffic, East Bay commuters might try to cut through the county on their way to San Francisco. More drivers on Marin’s roads means higher tolls, and then Marinites and Sonomans would have to pay more than before. Any toll plan would need to be implemented across the whole region to ensure all the region’s freeways are used as efficiently as possible and nobody is charged too much.
Build equity into the toll
One of the oft-cited problems with charges like this is that it is regressive as it hurts the poor, who have more time than money, more than the rich, who have more money than time. I outlined a solution briefly last time, [3] but here it is worth fleshing out a bit more.
Carbon taxes are often structured in such a way so as to be revenue neutral, [4] so whatever income is generated is refunded to the users. However, an unclog-the-roads toll, like what’s proposed here, should be used to increase the tolled travel corridor’s capacity and so needs to provide a useful income. This could be done either by selectively exempting vehicles registered to poor drivers, but that would be logistically difficult. Instead, tolls should be a refundable state tax credit that phases out as income increases. (Refundable tax credits are refunded to the taxpayer whether or not she owes any money, and so they are always returned.) FasTrak, or whoever the vendor is, would inform their registered users every year how much they paid in congestion tolls, which the users could report on their taxes. Non-registered users, like tourists or infrequent users, would not get a form so they’d end up paying no matter their income.
It’s difficult to estimate how much of the toll income would be refunded, but given that drivers tend to be wealthier in general, especially in the suburbs, this may not be a significant portion of toll revenue. Should it become viable to issue monthly rather than annual refunds to poor drivers, it would likely encourage driving, which would in turn increase congestion. That would require higher tolls, offsetting the revenue lost to refunds.
Regardless, because the toll essentially is trading time for money, and the amount of time currently used up in traffic is worth about $102 million per year, that is roughly how much would come in from these tolls.
Next time, we will consider just what might be done with this revenue stream to make travelers lives better.
Footnotes
* Traffic from 37 does add to congestion on Highway 101 to the south, and congestion does regularly crop up on the road, but the MTC analysis this post relies on [5] reports very little congestion on the road itself. Without a proper traffic management analysis, it would be tough to say how these tolls would actually shift congestion around the North Bay.
** This is current peak-hour flow divided by optimal traffic flow. Optimal traffic flow is the maximum capacity of highway lanes [6]; peak-hour flow is from Caltrans [7].
Works Cited
[1] David Edmondson, “The Science of Traffic and Its Awfulness,” The Greater Marin, July 3, 2017.
[2] Golden Gate Bridge, Highway, and Transportation District, “Comprehensive Annual Financial Report,” Annual Report (San Francisco, CA: Golden Gate Bridge, Highway and Transportation District, 2016).
[3] Edmondson, “The Science of Traffic and Its Awfulness.”
[4] UNFCCC, “Revenue-Neutral Carbon Tax,” Momentum for Change, accessed July 4, 2017.
[5] Metropolitan Transportation Commission, “Time Spent in Congestion,” Vital Signs, accessed April 29, 2017.
[6] John D. Zegeer et al., “Default Values for Highway Capacity and Level of Service Analyses,” National Cooperative Highway Research Program (Washington, DC: Transportation Research Board, 2008).
[7] Division of Traffic Operations, “2015 Traffic Volumes on California State Highways” (Sacramento, CA: Caltrans, 2015).