What if the Bay Area had never lost its railroads?

With the Northwestern Pacific reopening up soon as a limited commuter rail service - even though it need not - one wonders what the Bay Area would have looked like had it reinvested in its rail lines over the years rather than just rebuilt them. Well, it probably would look something like this:

Map by Theo Ditsek. Click to go to his post, where you can find a full-size image.

Map by Theo Ditsek. Click to go to his post, where you can find a full-size image.

I am always pleased to see our region's transit system reimagined by others, but I'm especially happy to see Theo Ditsek, one of the internet's more prolific transit map hobbyists, tackle the Bay Area, and tackle it like he did. From what I can see, he didn't leave a single rail line unused: there are rail lines from West Marin to Sausalito, subways through San Francisco, commuter rail to Santa Cruz, and shuttle lines heading every which way. My favorite, though, is the railroad to Tahoe.

Perhaps my only complaint is the lack of rail links from Marin and Vallejo to San Francisco, both for commuters and long-distance travelers. Beyond this, however, it's a truly marvelous piece of work. Now if only I could get it as a poster...

SMART Train alcohol policy comes up short

SMART wants to limit alcohol on its trains to only what patrons buy at the concessionaire. Experience from Caltrain shows that allowing riders to BYOB policy is not just good policy, but helps embed the system further into the culture of riders. 

Caltrain riders hanging out. Image from SF2G.com

Caltrain riders hanging out. Image from SF2G.com

For 18 years I have ridden Caltrain - and in that time I have brought aboard and consumed hundreds of bottles and cans of beers, which I have enjoyed legally on the train. This includes frequent patronage of the semi-official Party Car formed by the cyclists on Caltrain.

Starting in 2000, alcohol consumption on Caltrain increased exponentially with the opening of AT&T park, home of the San Francisco Giants. Giants fans have flocked to the train, riding up the Peninsula with cases of beer and bottles of who knows what, safely being carried to and from the games. At some point, Caltrain decided to ban alcohol on trains running after 9 PM only IF there is an event - primarily Giants games but also Sharks games, concerts at AT&T Park, and now 49ers games and concerts at Levi's Stadium. That late, the consumption before and during the events reach enough of a pitch that it was prudent to put a limit on the policy. Over the years the train has also served hugely alcohol-fueled events like Bay to Breakers, Hardly Strictly Bluegrass, Octoberfests, etc... frequently on the same day.

Generally speaking, this open BYOB policy on Caltrain has been a success. Problems are generally very rare, given the nature of the train as primarily a commuter rail with a higher level fare. It has been an attraction to the train that has a nominal positive influence on overall ridership numbers.

At the end of 2016, I will start riding a new train line - the SMART train in Sonoma County. It will function as primarily commuter rail, running almost exclusively during peak commute hours, with a fare structure prohibitive to general miscreants, making it nominally similar to Caltrain, except that it will serve no special events like the Giants as there are no major sports or entertainment venues on the train line.

SMART has released their draft code of conduct for the train. It includes a policy of NO BYOB. They don't have a no alcohol policy because they have an operating theorem of having a bar car on the train. I am very disappointed by this policy - I find it rider hostile and that it will have a negative impact on the rider experience and overall ridership. While there will be a bar car - there are bar cars on the Amtrak Capitol Corridor too, but in a place like Sonoma County with an excellent selection of beer and wine, to limit riders to the meager selection of a bar car is misguided.

There is, of course, the suspicion that the rationale is not to prevent unruly behavior, but to support whatever vendor they get for their bar car. This is understandable, for the most part because the decision to put a bar car onto the trains is misguided at best. SMART put out a presentation on the bar car where they are toying with giving free rent to the vendor for a return of a percentage of the profits. This is predicated on the presumption that a bar car will turn a profit - my experience from the Amtrak Capitols is that the bar car is at best a loss leader, not a profit center. This is especially true when you consider that SMART has wasted valuable train space to build the bar car.

I personally think that the potential ridership of SMART should make it clear that the no BYOB policy is not in line with the overall goals of the train. They should reconsider this path and allow riders to bring their own beverages onto the train.

If you agree - please email SMART at info@sonomamarintrain.org.

Originally Published: Murphy, John. 2016. “SMART Train Alcohol Policy.” Holier than You Blog. May 18.

Source: http://holierthanyou.blogspot.com/2016/05/...

Dear Readers

I’ve been gone. Sorry about that.

After finishing up a tough second semester at Cornell University studying for a master’s in City and Regional Planning, I’m off to Manila, capital of the Philippines, for an internship with the country's Department of Transportation, so expect some dispatches from there.

On the upside, having a summer off means I’ll have more time to devote to Marin’s issues specifically, like the aftermath of the election (seriously, Citizen Marin/CVP/Marin Post? The best conservative you could find is Al Dugan?).

So what have been the big takeaways from my first year as a master’s student? First, that 11-foot wide lanes really are just fine for putting traffic through Sir Francis Drake Avenue. That a freeway, or a road, has the highest capacity at LOS D or E. That the only way to solve traffic congestion is with pricing.

That the Rawlsian ethical imperative for equity and a market urbanist philosophy actually can mix, and that the Bay Area is failing at both miserably.

I also found evidence, through a statistical analysis of Census data, that adding more homes to a given neighborhood allows it to hold onto its poor and middle-class populations better. So if you care about keeping gentrification at bay, you should build new homes, luxury and affordable alike.

And that one of the reasons the trains of the early 20th century aren’t really around anymore is because they were so damn slow, like less than 30mph slow, and the companies didn’t realize the point of transportation is transportation, not luxury.

Speaking of old trains, in between classes I finished up the Map of the Mid-Atlantic, a Cleveland frequent bus map, and started work on a Saint Louis of 1921 map.

I have a couple of papers to adapt to blog posts here, including that statistics analysis, and also some that I promised long ago that still have not been published. Given that on Thursday I’ll be flying for more than 19 hours, I will hopefully get some stuff done for once.

 - David

Progress on the DC & Baltimore Map

It’s been a while, clearly, but there is progress. I’m in final check-up and labelling, which is a long slog. Pennsylvania, Western Maryland, Maryland & Pennsylvania, and the ferries are done. I’m also finding out whether or not I missed some lines, and boy did I miss a biggie. First, the progress map:

Historic-Railways-of-the-DMV-[Recovered].jpg

I had to re-do a couple of the river ferry lines to fit in the York River line. Mobjack Bay, which had ferry service to Norfolk, had to get cut. That’s fine, given the limitations of the map and the relative importance of getting to West Point from Baltimore compared to Mobjack service, but it’s a loss nonetheless.

I’ve also finished up the Pocomoke & Occohannock line, which was a true pain, with different service in either direction for almost every day of the week: 11 patterns in 7 days. Ugh.

Now, I’m on the final check-up: label all the lines coherently, color the lines appropriately, make sure there aren’t any spelling errors or misplaced lines or circles, and check to ensure all service is included. Labeling is some Excel work, which looks like so:

Percentages are the percent of times a train lumped into a given line will stop at that stop. It takes a lot of futzing to cut this down.

Alas that last thing, checking to ensure all service, is the Big Deal. 

When I started the map, I was only going to do lines that started within the confines of the contemporary DC & Baltimore Metropolitan Area. As I went along, I decided it would be more important to show all the connections there is space for. As a result, there are a few lines I missed. Hagerstown & Fredericksburg, for instance, has the Northern and Williamsport divisions, which I’ve now added in, but more important is what happens around Wilmington.

Around Wilmington, I missed the Wilmington Division of the Philadelphia & Reading, the Pomeroy Branch of the Pennsylvania, and the Landenburg Branch of the B&O. These all interconnect with either one another or Pennsy’s Octoraro Branch or both, which means some crazytown geometry and a reworking of some of the first lines I drew. How fun. On the plus side, it means we’ll get to see every station in Delaware, so it’ll be the first complete state in this series. Yay! Here’s the geographic map of what I’m up to:

Roughly the area bounded by the red box: Chadd's Ford Junction to Avondale to Newark to Wilmington. The electric lines shown here aren't listed in the Official Guide to the Railways, so they don't get to be included.

I also found a whole new railroad that I hadn’t seen, the New Park & Fawn Grove:

So yes, folks, I’m plugging away. What’s done:

  • Reviewed and labelled the Pennsylvania; Washington, Bandywine & Point Lookout; Maryland & Pennsylvania; Hagerstown & Frederick; Chesapeake Beach; Washington, Baltimore & Annapolis; Maryland, Delaware & Virginia; Western Maryland; and ferry lines
  • Added the Stewartstown and New Park & Fawn Grove railroads
  • The coastline

Here’s the to-do list in no particular order:

  • Add a couple of barrier island inlets on the Atlantic seaboard of the Delmarva Peninsula
  • Finish up the Wilmington Division of the Philadelphia & Reading, the Pomeroy Branch of the Pennsylvania, and the Landenburg Branch of the B&O.
  • Review the B&O; C&O; Norfolk & Western; Potomac, Fredericksburg & Piedmont; RF&P; Southern; Washington & Old Dominion; and Philadelphia & Reading railroads
  • Convert white label outlines to 80% transparent
  • Fill in the western Virginia whitespace
  • Add legend, list of service, and map title

Pre-orders are available in the Map Store.

The four biggest myths about induced demand

This post, by Connor Jones, originally appeared on Urbanist.co. It has been edited to include citations, including the correction of dead links.

Two weeks ago, I laid out the economic argument for induced demand (Jones 2014b): the idea that building more roads does not reduce congestion. It is a simple model that uses concepts from Economics 101 to explain the relationship between road construction and driving behavior.

Even so, this idea, like many associated with new urbanism, challenges the status quo. As such, there’s pushback. To ensure that no falsehoods go unchallenged, I decided to examine the claims in two articles that seek to discredit induced demand as a property. The first is a blog post from the Cato Institute (O’Toole 2014) written in response to a Wired article on the subject (Mann 2014) published last month, and the second is a Weekly Standard (Last 2011) story written three years ago (which is still fresh in urban planning time). Here are the four most prominent false assertions upon which the articles rely.

1. Since roadway capacity is not the only factor affecting driving, induced demand is a flawed model.

This misrepresentation was trotted out by the Cato Institute, which attempted to discredit the academic research of Gilles Duranton of the University of Pennsylvania and Matthew A. Turner of the University of Toronto, who measured the elasticity of demand of vehicle miles traveled (2011).*

On average, driving grew more than twice as fast as lane miles. But in Boston between 1983 and 1993, freeway capacities grew by less than 1 percent, while driving grew by more than 35 percent. In Madison, capacities grew by 35 percent, while driving grew by less than 20 percent. The wide range in differences between urban areas suggests that, not only are Duranton & Turner’s elasticities wrong, their standard errors are far too low. (O'Toole 2014)

Duranton & Turner’s headline finding was that the elasticity of demand in the transportation market is 1, according to roadway data from 1980 to 2000. In other words, holding other factors constant, a 20 percent increase in roadway miles elicits a 20 percent increase in vehicle miles traveled. “We found that there’s this perfect one-to-one relationship,” Turner told Wired (Mann 2014).

Cato fails to account the other variables that affect driving patterns like geography, population growth, and socioeconomic characteristics that Duranton & Turner specifically control for. Simply noting that all cities’ freeway capacities and driving patterns don’t fluctuate in lock step does not show anything.

Duranton & Turner sought to find the relationship between two variables alone and found a striking relationship. We live in the real world, and there are other factors that affect people’s behavior.

2. Cities that have invested in public interstates have seen long-term reduction in congestion.

The Weekly Standard blithely throws out this claim without qualifying it in any way:

The Texas Transportation Institute’s annual Mobility Report, for instance, demonstrates an uncanny correlation between capacity and traffic congestion: Areas that add capacity tend to have lower levels of congestion. (Last 2011)

First off, that’s not what the the authors of the Texas Transportation Institute’s Mobility Report (Schrank, Eisele, and Lomax 2012) found. Instead, they wrote that “additional roadways reduce the rate of congestion increase,” which is a substantively different assertion.

Additionally, their analysis is based on the assumption that roadway growth (supply) and vehicle miles traveled (quantity demanded) are independent of each other. While there are certainly other factors involved, the built environment contributes significantly to people’s behavior. Ignoring this fact is tantamount to building a new road, observing an increase in vehicle miles traveled, then assuming it would have happened anyway. This methodology leads to a skewed result, which isn’t matched by other studies.

The most robust study on the relationship between congestion and roadway growth comes from the Victoria Transport Policy Institute, which found that “Traffic congestion tends to maintain equilibrium. Congestion reaches a point at which it constrains further growth in peak-period trips. If road capacity increases, the number of peak-period trips also increases until congestion again limits further traffic growth.” (Littman 2015)

Plenty of academically-minded people before me have established the economic model. For one, Douglass B. Lee Jr. at the World Bank provides a more rigorous explanation (Lee, n.d.). A meta-analysis of induced demand studies by Robert Cervero in 2003** (Cervero 2003) found strong evidence of the existence of the phenomena, though different researchers have established different elasticity quotients . Recently, Duranton & Turner derived an elasticity of 1 with a very low standard error (2011).

(The Texas Transportation Institute study has several other problems that Tanya Snyder at Streetsblog USA (2013) and Todd Litman at the Transport Policy Institute (2014) can address more thoroughly than I can.)

Interstates according to writers at the Cato Institute and the Weekly Standard. Image by scot63us, on Flickr (2010).

3. Automotive transportation is the most efficient way of moving people around a city.

This contention isn’t really even a myth—it’s a fabrication. It has no basis in reality. This point was appended to the end of the Weekly Standard article:

A metropolitan area typically has about half as many jobs as people. But, because of geographical constraints, not every job is accessible to every person. Highways are, far and away, the most efficient way of delivering people to a job. (Last 2011)

In most American cities, auto transportation is the best readily-available way to transport people because there are no other options. That does not in any way imply that it’s the most efficient way to organize a city. On the contrary, car dependence is both inefficient and wasteful:

  • University of Michigan study: “Overall, in 2010, BTU per person mile was 4,218 for driving versus 2,691 for flying. Other modes of transportation: Amtrak trains (1,668), motorcycles (2,675) and transit buses (3,347).” (Sivak 2015)***
  • Portland’s dense development patterns yields $2.6 billion in yearly savings, which amounts to a 3.0 percent income bump relative to the average citizen of the United States (Jones 2014a).
  • Automobile congestion as a result of publicly-subsidized highways costs Americans at least $45 billion every year (Jaffe 2013).

4. Vehicle miles traveled isn’t an important metric.

This is a confused contention that doesn’t hold up to any scrutiny. For some reason, we shouldn’t be focusing on vehicle miles traveled as a metric because… we don’t like doing it? Again, from TWS:

[Principal at Demographia Wendell Cox] maintains that the entire framing of the issue is faulty: “Latent demand” for a highway, he notes, isn’t actually a desire to drive on that stretch of road. People only want the road as a means to an end. “Transportation is not a primary activity,” Cox explains. “There is no ‘love affair’ with the automobile. Driving is not something we would choose to do.” […] In other words, a metric like “vehicle-miles traveled” is only superficially important. (Last 2011)

Plenty of economic goods are means to an end. No client wants to pay up to mount a legal defense, but they do it anyway because they have to. Just because it’s a means to an end doesn’t mean we have to spend the money for it. With dense development and healthy public transit, families are able to spend less time in traffic and fewer dollars on gas without sacrificing mobility. Maximizing vehicle miles traveled should not be anyone’s objective.

Induced demand is an economic property with solid evidence

The key insight from the market model is that increasing roadway capacity will only make sprawl worse and won’t fight congestion. While car dependence hurts public health and wastes money, this economic principle does not imply that all highway construction is misguided. All planning is local. (Like politics.) There are plenty of good highway projects, but they must be balanced with investment in transit so that our cities can be strong, diverse communities where having a car isn’t a prerequisite for full citizenship.

End notes

For a more intuitive explanation of induced demand, see this insightful post from Greater Greater Washington on how building public roads to fill “latent demand” is like putting out more and more free hamburgers to feed people (Alpert 2012).

*Elasticity of demand (Heakal 2015) is the percent change in quantity divided percent change in price that measures responsive consumers are to changing their behavior given a price increase. This quantity can be visualized by the slope of the demand line.

**Editor's Note: The Cervero piece from 2001 originally cited by Jones has disappeared, but Cervero released an update to his research from 2003 that reinforces the points made in that earlier study. We have linked to that later study and updated the text to avoid confusion.

***Editor's Note: The Sivak piece from 2014 originally cited by Jones has disappeared, but, like Cervero, Sivak released an update to his research that reinforces the points made in that earlier study. We have linked to that later study.

Works Cited

In keeping with my university's standards, future blog posts will use in-text citations and a works cited. Often, these will be behind a paywall; please email me at thegreatermarin@gmail.com if you would like the full text.

Alpert, David. 2012. “Comment of the Week: Induced Demand Is Free Fast Food.” Greater Greater Washington. September 4. http://greatergreaterwashington.org/post/16029/induced-demand-is-like-free-fast-food/.

Cervero, Robert. 2003. “Road Expansion, Urban Growth, and Induced Travel: A Path Analysis.” Journal of the American Planning Association 69 (2): 145–63. doi:10.1080/01944360308976303.

Duranton, Gilles, and Matthew A. Turner. 2011. “The Fundamental Law of Road Congestion: Evidence from US Cities.” The American Economic Review 101 (6): 2616–52.

Heakal, Reem. 2015. “Economics Basics: Elasticity.” Investopedia. Accessed December 17. http://www.investopedia.com/university/economics/economics4.asp.

Jaffe, Eric. 2013. “The U.S. Transportation System Has $100 Billion Worth of Inefficiencies.” CityLab, October 1. http://www.theatlanticcities.com/jobs-and-economy/2013/10/us-transportation-system-has-100-billion-worth-inefficiencies/7076/.

Jones, Connor. 2014a. “Want to Reduce Reliance on Foreign Oil? Start with Walkability.” Urbanist.co. June 12. http://urbanist.co/want-reduce-reliance-foreign-oil-start-walkability/.

———. 2014b. “The Street Economics of Induced Demand.” Urbanist.co. June 25. http://urbanist.co/street-economics-induced-demand/.

Last, Jonathan V. 2011. “More Highways, Less Congestion.” Weekly Standard, March 7.

Lee, Douglas B. Jr. n.d. “Appendix B: Induced Traffic and Induced Demand.” In Concepts of Induced Demand. Washington, DC: World Bank.

Littman, Todd. 2014. “Congestion Costing Critique: Critical Evaluation of the ‘Urban Mobility Report.’” Victoria, BC: Victoria Transportation Policy Institute. http://www.vtpi.org/UMR_critique.pdf.

———. 2015. “Generated Traffic and Induced Travel: Implications for Transport Planning.” Victoria, BC: Victoria Transportation Policy Institute. http://www.vtpi.org/gentraf.pdf.

Mann, Adam. 2014. “What’s Up With That: Building Bigger Roads Actually Makes Traffic Worse.” Wired, June 17. http://www.wired.com/2014/06/wuwt-traffic-induced-demand/.

O’Toole, Randal. 2014. “Debunking the Induced-Demand Myth.” Cato at Liberty. June 18. http://www.cato.org/blog/debunking-induced-demand-myth.

Schrank, David, Bill Eisele, and Tim Lomax. 2012. “2012 Urban Mobility Report.” Urban Mobility Report. College Station, TX: Texas A&M Transportation Institute. http://d2dtl5nnlpfr0r.cloudfront.net/tti.tamu.edu/documents/ums/archive/mobility-report-2012.pdf.

scot63us. 2010. Highway. Digital Photograph. Flickr. https://www.flickr.com/photos/scottummy/4971054099/.

Sivak, Michael. 2015. “Energy Intensities of Flying and Driving.” UMTRI-2015-14. Ann Arbor, MI: University of Michigan. http://www.umtri.umich.edu/what-were-doing/news/planes-trains-and-automobiles-traveling-car-uses-most-energy.

Snyder, Tanya. 2013. “TTI Urban Mobility Report Bungles Congestion Analysis Yet Again.” Streetsblog USA. February 5. http://usa.streetsblog.org/2013/02/05/tti-urban-mobility-report-bungles-congestion-analysis-yet-again/.

Original Post

Jones, Connor. 2014c. “The Four Biggest Myths about Induced Demand.” Urbanist.co. July 7. http://urbanist.co/busting-four-biggest-myths-induced-demand/.

The street economics of induced demand

This post, by Connor Jones, originally appeared on Urbanist.co. In keeping with The Greater Marin's style, in-text citations have been added.

There’s a lot of misinformation out there about induced demand (Littman 2015), a widely established city planning model that attempts to explain why cities tend to maintain a steady state of congestion. I’ll go into some more detail on the theory of induced demand later, but I wanted to start with the economic model.

Image by Connor Jones, Urbanist.co

Auto transportation market

The amount that people drive is determined by market forces of supply and demand. Consumer preferences about driving are provided by the demand function, which shows that drivers choose to drive less as the cost of driving increases. Conversely, the supply function is a representation of the existing stock of roadways. In this case, the cost of auto travel is congestion.

Model Assumptions

The principle assumption is that the primary variable cost of auto travel is the time it takes to get from point A to point B, which is reasonable since the fixed cost of owning a car far outweighs the cost of gas for a majority of consumers. (Consider a worker who makes $15 an hour full time. An increase in average commute times by 12 minutes per day decreases his income by $750 a year—the equivalent of a 2.5 percent pay cut.) Even so, the price of gas does factor into people’s driving decisions, so we have to assume that the price of gas is constant. Furthermore, we assume that consumers’ driving preferences are constant. (More on this assumption later.)

Mechanics

The most common justification cited for building a new roadway is to reduce congestion, which makes sense. Most localities will commission a traffic study, which frequently assume constant growth of drivers and therefore also congestion.

Induced demand shows a different story, however. According to our model, the increase in the stock of roadways shifts the supply curve out, which does, in fact, reduce congestion in the short term, but, not as much as it would were there not growth in the number of vehicle miles traveled. Since the cost of driving is reduced, drivers both make longer and more frequent trips in the short term. As we can see from our graph, the number of vehicle miles traveled increases from q1 to q2.

In the long term, the reduced congestion encourages the construction of less dense housing developments far from the city center. With the new roadway, commuters can live farther from their places of work and leisure at the same cost. Over time, these developments shift the demand curve out, reducing the gains against congestion and further increasing the number of vehicle miles traveled.

The effect on cities

The auto transportation market explains the intuition that building more freeways makes a city more car-dependent and encourages sprawl. In very many documented cases (which I will summarize on Friday), building a new roadway does not reduce congestion for very long. Cities that invest in auto infrastructure do not see improvement in congestion (Gehl 2010).

What traffic engineers assume

According to Jeff Speck in Walkable City (which I’m still reading), traffic engineers commonly assume that demand for roads will increase at a constant rate, year over year (2013). With that assumption in place, you can see how they could come to the conclusion that a new freeway will improve congestion in the long term. The market movement without induced demand is illustrated below.

Image by Connor Jones, Urbanist.co

The conclusions reached are vastly different. Under these assumptions, after opening the freeway, there is no increase in vehicle miles traveled (which is not corroborated by real-world data.) The reduction of congestion is larger than the induced demand model predicts, and the only growth in demand is independent on roadway growth.

Caveats

The relative sizes of the movements along the curves will vary depending on the slope of the demand curve (which is dependent upon consumer preferences, which vary from place to place). We will examine the variation in the relative effects of induced demand later this week.

Public policy implications

Government-supported roads are effectively subsidies for motorists. Without as much investment in roads, the free market would have a greater incentive to create public transportation and dense housing options in city centers. For this reason, the enemy of the walkable city is the six-lane freeway. As I have argued before (and will no doubt argue again), walkability serves several public policy goals at once (Jones 2014a).

Works Cited

h/t to Jeff Speck’s Walkable City, where I found much of this information. All resources:

Federal Highway Administration. 2012. “Induced Travel: Frequently Asked Questions.” Office of Planning, Environment, & Realty (HEP). December 3. http://www.fhwa.dot.gov/planning/itfaq.cfm#q4.

Gehl, Jan. 2010. Cities for People. Washington, DC: Island Press.

Jones, Connor. 2014a. “Want to Reduce Reliance on Foreign Oil? Start with Walkability.” Urbanist.co. June 12. http://urbanist.co/want-reduce-reliance-foreign-oil-start-walkability/.

Littman, Todd. 2015. “Generated Traffic and Induced Travel: Implications for Transport Planning.” Victoria, BC: Victoria Transportation Policy Institute. http://www.vtpi.org/gentraf.pdf.

Mann, Adam. 2014. “What’s Up With That: Building Bigger Roads Actually Makes Traffic Worse.” Wired, June 17. http://www.wired.com/2014/06/wuwt-traffic-induced-demand/.

Schmitt, Angie. 2012. “Report: Traffic Studies Systematically Overstate Benefits of Road Projects.” Streetsblog USA. July 6. http://usa.streetsblog.org/2012/07/06/report-traffic-studies-systematically-overstate-the-benefits-of-road-projects/.

Speck, Jeff. 2013. Walkable City: How Downtown Can Save America, One Step at a Time. 1st edition. New York: North Point Press.

Original Post

Jones, Connor. 2014b. “The Street Economics of Induced Demand.” Urbanist.co. June 25. http://urbanist.co/street-economics-induced-demand/. Reposted with permission.

A case for the comprehensive bike network

A couple of weeks ago, commenters were largely negative to the idea of protected bicycle lanes on Sir Francis Drake Boulevard for safety reasons and for the reason that the Corte Madera path already existed. But why should we build protected bicycle lanes along high-speed corridors at all? The weight of evidence says it would be of great benefit to cycling in the county generally and to our high-speed corridors specifically.

Network effects

In the Kentfield-Greenbrae corridor, the cycling network is incomplete. The Corte Madera Creek path is a wonderful segment of that network, but it only works for some people. For anyone living north of Sir Francis Drake – yes, there are plenty of flat, bike-friendly streets – that path is useless for getting around the neighborhood. Often, staying off Sir Francis Drake doubles trip times, something no driver would be willing to do.

This holds true for other corridors, and it’s not surprising. Since the rise of the car, arterial roads have become the backbone of our commercial economy. Quiet streets are saved for our showpiece downtowns and residential neighborhoods while high-speed roads serve our everyday shops, like supermarkets, banks, retailers, doctor’s offices, post offices, coffee shops, and the like. By pushing bikes off the high-speed streets, we effectively take biking off the list of acceptable ways to get around for everyday errands.

And there are the benefits of network effects. Though each individual project might not add much to bike ridership, building a complete network will mean every completed segment will add to the usefulness of every other segment. One fax machine is a paperweight. A fax machine in every office, however, makes that one machine very useful. A new safe bike lane on Sir Francis Drake is useful to those living near it. Another one on Corte Madera’s Tamalpais Avenue is useful to those living near that street.

Add a link to Redwood Highway and suddenly you have a network, making both Tamalpais Avenue, Redwood Highway, and Sir Francis Drake useful to anyone along any of those routes while also adding value to the Corte Madera Creek path and the Sandra Marker trail. Any other links – like Bon Air Road or San Anselmo’s Red Hill Avenue – expand the capabilities of the formerly isolated segments even further.

This is backed up by research. Jessica Schoner and David Levinson of the University of Minnesota found that “connectivity and directness are important factors in predicting bicycle commuting after controlling for demographic variables and the size of the city” (Schoner & Levinson, 2014) Since commuting is a minority of trips, and these high-speed roads are also lined with shops and services, the effect on overall trips by bicycle will be larger than expected.

As well, Schoner and Levinson didn’t differentiate between the quality of the bike link, whether it’s a painted bike lane, an off-road path, or a protected lane like what I propose. Other studies (Heinen, Maat, & van Wee, 2011; Tilahun, Levinson, & Krizek, 2007; Wardman, Tight, & Page, 2007) have found that the quality of the bike lane has a meaningful impact on bike-to-work rates; Heinan, Maat & van Wee found this was especially true for short trips. These strongly imply that safer lanes will have a meaningful impact on non-work trips, especially on short trips.

The safety problem

The principal objection to having a protected bicycle lane on a high-speed road was one of safety. Commenter Ann Becker remarked, “A heavily traveled street with traffic going at speeds of up to 40 mph is simply not safe for bike riders, either school age or older.”

Research does not bear out Becker’s assertion. New York City’s Department of Transportation released research indicating traffic collision injuries dropped by an average of 20 percent following the installation of protected bike lanes along major avenues (Miller, 2014), which are often just as unfriendly to people on bikes as Sir Francis Drake. Other studies (Harris et al., 2013; Lusk et al., 2011; Teschke et al., 2012) have found even more significant drops in injury crashes to all road users, including drivers, after the installation of protected bicycle lanes. This holds true even on fast streets like Sir Francis Drake.

All this assumes we agree that bicycling is good for the environment, good for physical and mental health, and good for the economy (Maus, 2012), and it is indeed all those things. Given that a strong network encourages bicycling while also improving road safety, there is no reason to keep protected bicycle lanes off the road, even high-speed roads. As I laid out two weeks ago, we can add protected bicycle lanes to Sir Francis Drake without sacrificing any eastbound lanes. With the heavy weight of evidence, we can further add that this would be of huge benefit to anyone who lives, works, shops, or drives along that boulevard.

Works Cited

In keeping with my university's standards, future blog posts will use in-text citations and a works cited. Often, these will be behind a paywall; please email me at thegreatermarin@gmail.com if you would like the full text.

Harris, M. A., Reynolds, C. C. O., Winters, M., Cripton, P. A., Shen, H., Chipman, M. L., … Teschke, K. (2013). Comparing the effects of infrastructure on bicycling injury at intersections and non-intersections using a case–crossover design. Injury Prevention, 19(5), 303–310. http://doi.org/10.1136/injuryprev-2012-040561

Heinen, E., Maat, K., & van Wee, B. (2011). The role of attitudes toward characteristics of bicycle commuting on the choice to cycle to work over various distances. Transportation Research Part D: Transport and Environment, 16(2), 102–109. http://doi.org/10.1016/j.trd.2010.08.010

Lusk, A. C., Furth, P. G., Morency, P., Miranda-Moreno, L. F., Willett, W. C., & Dennerlein, J. T. (2011). Risk of injury for bicycling on cycle tracks versus in the street. Injury Prevention, ip.2010.028696. http://doi.org/10.1136/ip.2010.028696

Maus, J. (2012, July 6). Study shows biking customers spend more. Retrieved from http://bikeportland.org/2012/07/06/study-shows-biking-customers-spend-more-74357

Miller, S. (2014, September 5). New DOT Report: Protected Bike Lanes Improve Safety for Everyone. Retrieved from http://www.streetsblog.org/2014/09/05/new-dot-report-shows-protected-bike-lanes-improve-safety-for-everybody/

Schoner, J. E., & Levinson, D. M. (2014). The missing link: bicycle infrastructure networks and ridership in 74 US cities. Transportation, 41(6), 1187–1204. http://dx.doi.org.proxy.library.cornell.edu/10.1007/s11116-014-9538-1

Teschke, K., Harris, M. A., Reynolds, C. C. O., Winters, M., Babul, S., Chipman, M., … Cripton, P. A. (2012). Route infrastructure and the risk of injuries to bicyclists: a case-crossover study. American Journal of Public Health, 102(12), 2336–2343. http://doi.org/10.2105/AJPH.2012.300762

Tilahun, N. Y., Levinson, D. M., & Krizek, K. J. (2007). Trails, lanes, or traffic: Valuing bicycle facilities with an adaptive stated preference survey. Transportation Research Part A: Policy and Practice, 41(4), 287–301. http://doi.org/10.1016/j.tra.2006.09.007

Wardman, M., Tight, M., & Page, M. (2007). Factors influencing the propensity to cycle to work. Transportation Research Part A: Policy and Practice, 41(4), 339–350. http://doi.org/10.1016/j.tra.2006.09.011

Build something better on South Sir Francis Drake

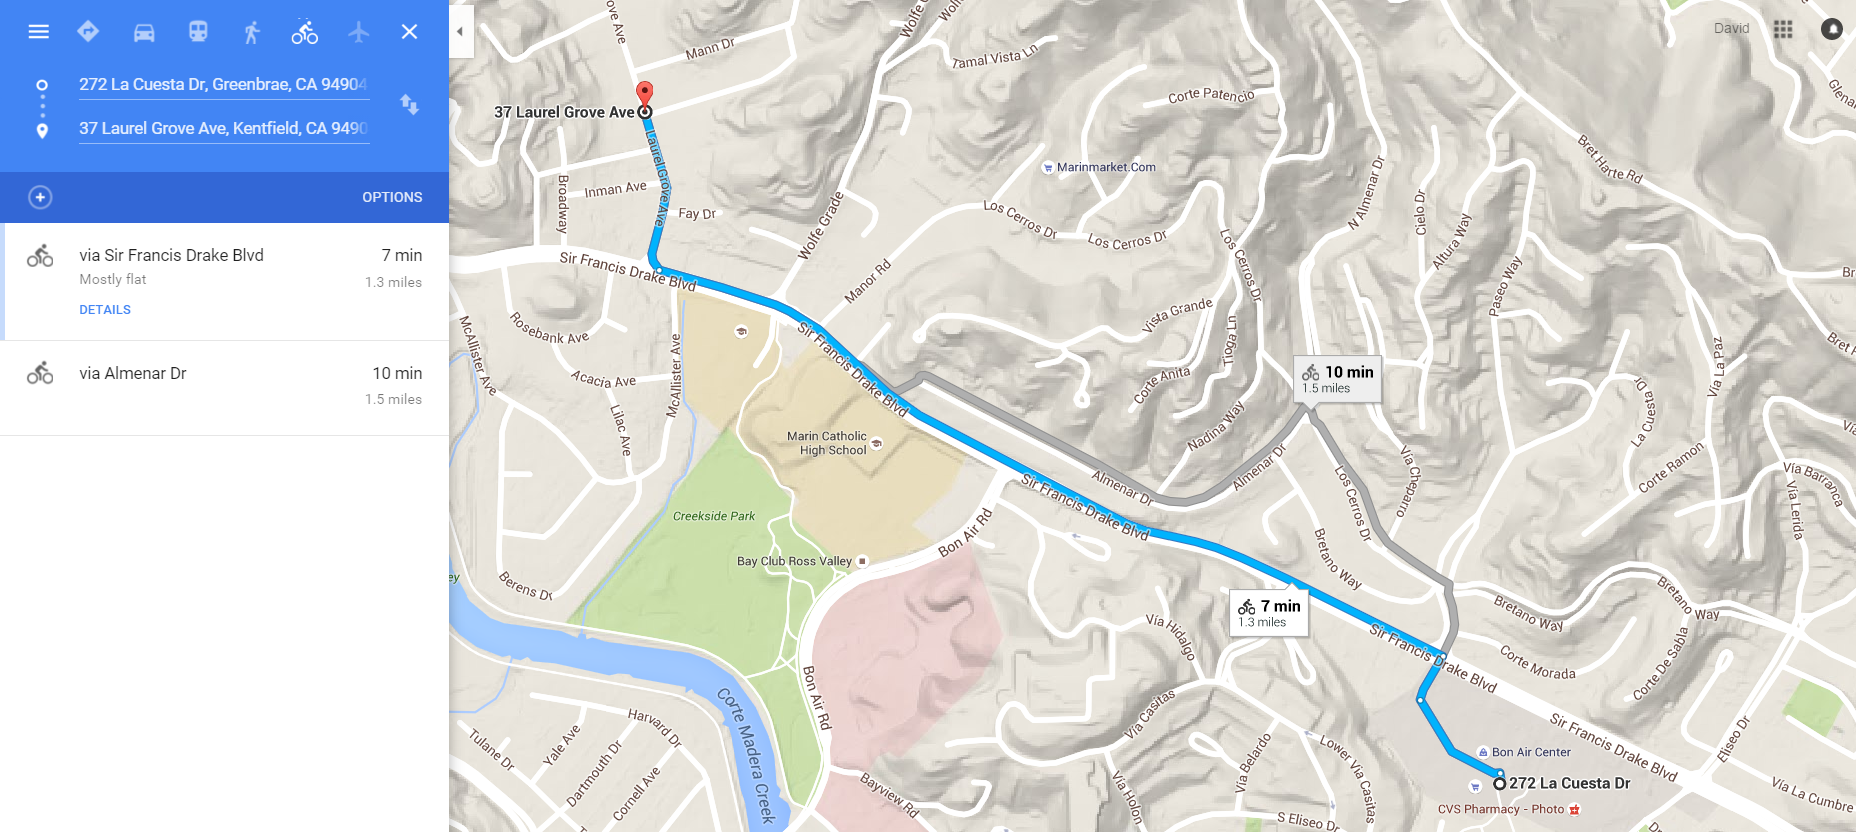
Tonight, the county will hold a hearing on rebuilding and enhancing Sir Francis Drake Boulevard from the Ross border to Highway 101. (Details: 7pm, College of Marin, Kentfield Campus, Fusselman Hall 120, project site here.) This provides a golden opportunity for Marinites to transform and improve one of Central Marin’s most important streets to better serve people in cars, on bikes, on buses, and on foot.

Congestion sucks

From a workshop survey in late October, people called traffic congestion the worst problem along the corridor, and it’s not hard to see why. Drivers have to deal with stop-and-go traffic all along Bon Air Shopping Center to 101 in the morning, and a number of intersections are overloaded at the same time. This, of course, sucks for drivers and bus riders alike, as well as anyone living, working, or shopping along the corridor.

Walking and biking along Drake is also a pain. As a 35-mph roadway with narrow and sometimes nonexistent sidewalks, it is impossible to feel welcome either on foot or on bike, a major problem for kids and their parents, as well as those who don’t have their own car.

But Sir Francis Drake isn’t just a traffic sewer. North of Bon Air, Drake serves as a main street for Kentfield and College of Marin, and a vital access to Bacich Elementary and Marin Catholic High schools. How to connect these uses together with the high-capacity roadway to the south is a quite challenging question.

Design advice

Though it’s important to lay out priorities before tackling a planning problem, along this corridor the traffic concern is overriding. So, instead of laying out priorities, let’s lay out the tools in our toolbox:

  • Intersection Design
  • Segmenting travel modes
  • Adding car lanes

Each of these will relieve some stress on the roadway, either by improving volume (the second two) or easing traffic flow generally (the first one). We also want to make sure that any additional lanes are consistent – it’s a bad idea to start a lane and then end it.

The presentation in October split up Drake into 4 segments: Ross Limits to Broadway; Broadway to Wolfe Grade; Wolfe Grade to El Portal; and El Portal to 101. Each segment’s right-of-way (property line to property line) is a different width, which makes planning consistently difficult.

Nevertheless, I’m unimpressed by the solutions presented. Unprotected bicycle lanes on a 35mph road will simply never be used. This might be excusable if there weren’t space for buffers, but a huge amount of space is dedicated to a center turning lane and median. As well, 11-foot lane widths, though a huge improvement to the 15-21-foot lanes, are wider than a city street ought to be. Lanes of 10 feet should be standard. For comparison, freeway lanes are generally 12 feet wide.

Here are current conditions, the county’s ideas, and my own ideas. Note that despite having protected bike lanes, there are no proposed eastbound traffic lanes cut, meaning the roadway's throughput will remain enhanced where it is most under pressure.

Segment 1: Ross Limits to Broadway

Hover over each of the following to see commentary.

Segment 2: Broadway to Wolfe Grade

Hover over each of the following to see commentary.

Segment 3a: Marin Catholic

Hover over each of the following to see commentary.

Segment 3b: Bon Air Road to El Portal

Hover over each of the following to see commentary.

Segment 4: El Portal to Highway 101

Hover over each of the following to see commentary.

Protected bike lanes drive bicycling use

The reason I have added protected bicycle lanes to each segment is because they push for a relatively fantastic increase in cycling use. At the moment, just 1 percent of users along Drake are on bike, probably in part because of how difficult it is to bike along the route. Boosting that percentage even a bit - to 5 percent - could do a lot to cut down on traffic, especially around school times.

Congestion is the result of a tipping point, where the traffic levels rise just a bit too much, causing speeds to fall off a cliff. Taking just a few trips off the road can have an outsize effect on congestion levels. When paired with a wider road, as both the county and I propose, it should do wonders to cut down on traffic. The lanes may also soak up some of the induced demand from driving that occurs whenever a road's capacity is increased, prolonging the usefulness of this improvement.

Intersection Design

For each of the proposals I generated, intersections should be redesigned to allow the easy flow of people in all modes. Check out the full presentation for info on the proposed intersections, which do a great job for pedestrians, but they are insufficient for protected bicycle lanes. I've uploaded some options from the NACTO bicycle guide below.

If you're going to go to the meeting at this last minute - I myself only found out about it today - then get yourself to College of Marin at 7pm, Fusselman Hall 120. 


Downtown Novato is a better place for a train

Novato's old station. Image by Jeff on Flickr.

Novato's old station. Image by Jeff on Flickr.

Novato is reconsidering its decision to push SMART out of downtown Novato and adjacent to Fireman's Fund. While the calculus seems to be based around the decision by Fireman's Fund to move, population and jobs numbers today show a downtown location makes much more sense.

Generally speaking, planners define the the catchment area of a train station as a 15 minute walk, or a roughly half-mile radius circle around the station location. Using this metric, the Fireman's Fund station hosts about 650 jobs, down quite a bit from its peak of 2,400 jobs in 2000. It's also near 571 people who might want to take the train north or south. Around the downtown station, however, there are still 2,400 jobs and nearly 1,100 people.*

It doesn't take a rocket scientist to see that the downtown station area will serve more people and more jobs, but it's worth quantifying the effect on ridership. Using a back-of-the-envelope ridership calculator,** moving the station from Fireman's Fund to Atherton will result in a roughly 4% ridership boost to the system.

More than that, downtown Novato is a much more walkable and livable part of the city than the Fireman's Fund office park and may attract more non-commuter riders. It's a natural place for a transit station.

Novato should move its station posthaste. With SMART service coming in about 16 months, it can't afford to wait.


*Source: U.S. Census Bureau. 2015. OnTheMap Application. Longitudinal-Employer Household Dynamics Program. http://onthemap.ces.census.gov/

**Source: Transit Cooperative Research Program. Making Effective Fixed Guideway Transit Investments: Indicators of Success. Washington, DC: Transportation Research Board, 2014. Web. 5 Sept. 2015.

Four visions of a higher-speed Bay Area rail network

The Bay Area is a sprawling region, no doubt about it. It stretches from Napa Valley to Silicon Valley, Pacific Ocean to Sacramento River Delta, is nearly as large as New Jersey or Cyprus. Yet this size means its various economies are disconnected to such a degree that the Census Bureau has split it into two different metropolitan areas.

Dr. Alasdair Rae recently mapped the commuter flows throughout the Bay Area and found it was a hotbed of long-distance commuters, no surprise given this size. While driving is all well and good for some commuting, the resulting traffic means freeways are ineffective at moving large numbers of people long distances at rush hour. Moderate to high-speed rail is the only solution that can provide a reliable and fast commute to stitch the region into a unified whole.

Adapted from the Asian Development Bank, Changing Course in Urban Transport: An Illustrated Guide. 

The basic map created by Dr. Rae is what he calls a “desire line” diagram: it draws a line between every census district that has 50 people or more commuting between the two. It can be the backbone of a new HSR system.

Image from Dr. Alasdair Rae. Click for his write-up.

Image from Dr. Alasdair Rae. Click for his write-up.

To my eyes, it's clear there are some major commuter axes. The primary center is doubtless San Francisco. The secondary centers are Oakland, Fremont, Silicon Valley, and San Jose. Tertiary centers are San Rafael, Santa Rosa, Napa, Fairfield, Richmond, Walnut Creek, and Livermore/Pleasanton. The corridors that link these together are prime candidates for higher-speed rail, with a top speed of 125mph and average speeds around 50mph, depending on stop spacing.

Four people – me, @TaupeAvenger, @aSmallTeapot, and @UrbanLifeSigns – took a turn drawing what might be an effective railway system based on the above. Each assumes Caltrain’s new electric trains will be standard throughout the system. BART, with its top speed of 80mph and 33mph average, will stay in place in each scenario.

My own plan focuses on the North Bay and the core:

The Edmondson Plan

This plan serves the North Bay commuter corridors at the expense of the South and East Bay. These corridors were better served by expanded lower-speed rail service, more akin to BART than the fancy moderate-to-high-speed rail service I envisioned. Gray lines here indicate moderate-speed connections between the twin branches.

TaupAvenger's plan:

The Taupe Plan

Taupe, too, focused on northern branches to Santa Rosa, Napa, and Sacramento and left the East Bay for another system, but he added a new rail crossing from Oakland to San Francisco, presumably using the Sacramento line. Particularly quirky is that the Napa line proceeds to San Francisco via San Rafael rather than Vallejo. Presumably, commuters from Napa to the East Bay will either transfer at San Francisco or utilize lower-speed transit.

Teapot's sketch went the extra step of labeling the lines:

The Teapot Plan

Unlike the Edmondson or Taupe plans, the Teapot plan includes a high-speed rail connection through Diablo Valley, though that line begins at Napa rather than Vallejo. Also of interest is that San Francisco lies only on Line 1. Even Marin, whose out-commuters tend to be destined for San Francisco, only get a BRT line to The City. On the upside, central cities are poor places for line termini, so running the line through Transbay Terminal makes a lot of sense.

Finally, Urban Life Signs sketched out this plan, including BART-speed segments (green) and California's statewide HSR (outline):

The Urban Life Signs plan

This system is more or less my own, with a key difference in that it includes San Jose-Diablo Valley service and a moderate-speed connection to Stockton. Placing the end of the Diablo Valley line at Walnut Creek may not make for the most attractive network, but it does serve the commuter flows best (notice the lack of commuting between Solano County and central Contra Costa in Dr. Rae's data).

At average speeds of 60mph, including time stopped at stations, these plans still won't allow a commuter to easily go from, say, Santa Rosa to San Jose in much less than 1:45 but it would be far more reliable than a car journey that same distance at rush hour. And it would be a huge improvement to the current transit system, takes 4:06 for the same journey.

A principal problem with our transit system is that our region lacks the hierarchy of transit service that it has in its road system. We have our local service (buses), arterial service (light rail) and expressway service (BART) but we lack good intercity highway service (high-speed rail). As a result, long-haul commuters must turn to cars and jam our roads.

So while these HSR plans may be rough and fantastical, and would be quite expensive, they do present a future that is worth considering.

New map coming to the store: Ithaca

In my new home of ithaca, New York, you can hear the trains go by every day, as freight rail uses old tracks running through town. For town residents and students, this is a painful reminder of how damn tough it is to get anywhere from Ithaca. Each blow of the horn makes us dream of passenger lines gone by.

To add fuel to the dreams, I've published a new map: Ithaca, 1921.

The map's current iteration. Click for full=sized map.

The map's current iteration. Click for full=sized map.

What's available now is just a draft, but I'm giving things a week for edits. Please let me know in the comments below how you think this map might be improved. If you're interested, the map can also now be preordered in the Map Store.

This was a side project when I needed a break from the the DC/Blatimore map. Unlike DC/Baltimore, the Ithaca map is very simple, with few lines and just a relative handful of stops.. In fact, the map was simple enough that I mapped out all service patterns, even those served by just one train per day.

Such a small project is remarkably satisfying, as the size cuts down on the tedium of data entry and labeling lines. If other projects take unexpectedly long, I may do other low-intensity maps.

So to all Ithacans: let me know how to make this better, and get one for your own wall. Ithaca may be Gorges, but it's got a history of steel and steam to celebrate, too.

Mapping Ferries, Circles, Curves

I'm building contemporary subway-style maps of historic railway networks and updating everyone on the progress. You can buy or preorder here.

Diagrammatic transit maps, like the ones I’m building, have two primary principles: even stop spacing and clear, straight lines. There’s a lot more to it, of course, as the Transit Maps blog makes abundantly clear, but those are the basics.

Ferry lines throw one of these – straight lines – clear out the window.

The differences between the straight and curvy ferry lines are quite apparent.

When I first started to draft the DC/Baltimore map, I wanted to make sure the ferry lines were included but that they would be straight, dammit. This looked great on the great white vastness of a blank canvass. It looked less great when I started adding water. Suddenly, the ferries were travelling along the beach, or the docks were in the middle of the river. It was ugly and flew in the face of what we intuitively know about how ships work.

But I didn’t want to make the same mistakes as the Sydney ferry map, and the St. Petersburg map didn’t work with my stop symbology. I wanted to show the stop circles halfway on land, halfway off, with the ferry line easily sliding behind as it wound its way back to Baltimore.

This meant curves, and that meant circles, and that meant high school geometry:

Not really the work I did, but it's the basic problem, if I remember correctly. The rest involved tangents and sine/cosine stuff. I don't remember.

Not really the work I did, but it's the basic problem, if I remember correctly. The rest involved tangents and sine/cosine stuff. I don't remember.

After cutting the Illustrator-generated circles appropriately, I made it into a series of symbols I could paste together. Once a line is finished from Baltimore to wherever, I stitch each of the line segments together and move them onto the right layer. The final product doesn’t look quite as neat as the original straight line, but I think the result is pretty good.

From a historical perspective, there aren’t really ferry-fans in the same way there are railfans. Schedules, wharfs, and old maps are very difficult to find online, leaving me to hunt around on Google Maps for clues as to where a given ferry actually landed.

Of course, most of these towns don’t even exist anymore, if they ever were more than a pier in the middle of the countryside. That means the only way to know on which side of the river a wharf was is to look for the wharf road, which generally does still exist, or find some subdivision named for local geography.

All in all, this is a much more laborious process than a simple rail line, but it is well worth it. Many times, these ferry runs were the only easy way to get to remote river and island communities. Even if they only ran once a day or even once a week, they were a lifeline. I can only imagine what it was like to go on an overnight river cruise from Baltimore to West Point or Washington with the most backcountry of folk. The whole point of this project is to lift the veil of expertise that shrouds historic transportation networks, and this important part of the network is very much shrouded.

The injustice of bundled parking

The other day, we looked at a new apartment building proposed for downtown San Rafael with mindbogglingly expensive parking and tried to determine how the project could be improved. One big way that deserves a second look is allowing people to rent parking spots and apartments separately.

Thanks to city law, a developer is not allowed to unbundle the cost of those parking spaces from the rent it charges tenants. Tenants don’t get the choice of whether they get a parking space or not. They just do.

Unlike a single-family home, however, these garages aren’t adaptable. A tenant can’t just use their reserved 153 square feet (8’6” by 18’) for storage or as a workspace. Adaptation isn’t just impractical, but per the city code, it would be illegal. Instead, the parking space will just sit, an empty slab of concrete soaking up $700 per month in rent. That raises the income needed to rent a market-rate home by $25,200. This is fundamentally unfair, soaking money from tenants for a resource that may not be used, damaging the vitality of the city. It gets worse.

If I’m already paying for car storage, then it’s a strong incentive for me to get a car. The developer has already spent over $55,000; I might as well go the extra $5,000 and buy a car. That will incentivize me to do things like drive more, avoid transit, and otherwise help choke up the roads and air. It gets worse.

If I’m paying $700 per month for the required car storage and another $300 per month on car ownership (car payments, gas, maintenance), that’s $1,000 I won’t be able to spend around Marin, depressing my value as a resident. That’s $12,000 per year leaving the county rather than going to local business (gas and maintenance shops ship most of their income out of the local economy).

Not only does this law restrict personal freedom of choice, it drains away hundreds of thousands of dollars from the local economy each year, and that’s just on this project. If San Rafael’s empty parcels get a similar treatment, it will be millions. It encourages car ownership and traffic and wastes the money of people who might want to go car-free.

There are three, radically simple solutions.

Repeal the parking minimum requirements for all new development in San Rafael. Developers know that they need parking sometimes to sell or rent units, but the city shouldn't substitute the judgment of skilled businesspeople for the judgment of whoever wrote the parking codes long ago.

Allow developers to unbundle parking spaces from any rent or purchase. If someone wants to buy or rent a place to keep their car, they're welcome to it, but like most products it shouldn't be forced upon consumers.

Allow parking space owners or renters to use the space for other purposes, whether a storage unit or even a workshop. It's a lot of square feet, and the owner/renter is paying for it. They should have a right to do whatever they like with it.

Each of these may have some unintended consequences, which we'll discuss next week.

Checking in DC/Baltimore Railways in 1921

It's been many weeks since the last update on the mapping projects - it will be weekly from here on in - but there has been considerable progress made on the DC/Baltimore map.

When last we met, I had finished up Baltimore and was on my way to Washington. We've made it way, way out of Washington now, with service patterns to Hagerstown, Richmond, and York all laid out. I've finally started to chart out river ferry service, which means laying out geography, and that means I can start putting together service to the Eastern Shore and Delaware.

How far we've come.

How far we've come.

With 950 or so stops to cover, this has been the largest single project I've done. Given that it's nearly August, and the expected delivery was June, this is also taking much longer than I thought it would. And, it's only getting larger, with additional railway service in the Eastern Shore, where there's room for it, and a new connection between Winchester, Martinsburg, and Hagerstown.

In the end, this will show nearly all of the railway networks of Maryland and Delaware and about a quarter of Virginia's, along with slivers of West Virginia and Pennsylvania. I'd like to revisit these states and do state-isolated maps at some point, but not for a long while.

The purpose of maps like this is to show some of the underlying travel patterns that informed our built environment. As well, when activists consider whether to convert an old railway to a trail, or to build a new rail line, they may want to look at old rights-of-way to see whether there's some latent transit potential there.

This map is available for pre-order in the Map Store, alongside finished prints of the Marin County Interurban in 1939 and the San Francisco Bay Area in 1937.

How to improve the San Rafael apartment proposal

On Wednesday, news broke that San Rafael could soon find itself home to another 162 households, thanks to a proposed redevelopment of the Third Street garage and a couple ancillary buildings. This is the kind of development San Rafael needs more of, and the unique parking situation means it could get even better.

The basics

Lennar Multifamily Communities wants to build a 60-foot, 162-home building on Fourth Street across from Courthouse Square. Of these, 11 percent will be affordable. This is within the scope of downtown zoning and height limits, as well as within the realm of San Rafael’s place as Marin’s urban core.

Thanks to parking minimums, the lots where Lennar wants to build – 1001 Fourth Street and 924 Third Street – are too small to fit homes, businesses, and parking all on-site. To make things work, Lennar wants to incorporate and rebuild the 180-space Third Street garage, fulfilling San Rafael’s long-time goal of rebuilding the old structure.

This is on top of the minimum parking requirements for the apartments themselves, which comes to 194 spaces.

Parking is hella expensive

The Third Street garage is curiously expensive. The cost to tear down and rebuild has been estimated by the town to be about $10 million, or about $55,556 per space. This is well above the average for above-ground parking garages. Although some of the cost may be in demolition, it is still over 3.5 times the national average (PDF) ($15,552), and well over twice the cost of construction in San Francisco ($19,253) and New York City ($20,326).

If this is the cost of building a parking garage in downtown San Rafael, then over $20 million of development cost will be absorbed by parking alone - $10 million for the garage, $10 million for the additional spaces. The rest of the construction will probably cost around $14.3 million*, which means 60 percent of the cost of construction will be taken up by parking. It speaks to the huge demand for homes in Marin that this is even considered feasible.

Parking reform

Given the astronomical cost of parking in this project and the eminently walkable nature of downtown San Rafael, this may be a good place to eliminate parking minimums for affordable units, and to unbundle parking rental from apartment rent.

About a month ago, Dick Spotswood proposed eliminating parking requirements for affordable housing. Although I don’t believe he was serious – he regularly backs car-centric activists, politicians, and thinkers – perhaps we should take him seriously anyway.

Doing so here, with the current 11 percent affordable ratio, would eliminate 23 spaces from the project. That would shave $1.3 million from construction costs. If the affordability ratio were raised to 20 percent, it would cut 40 spaces, shaving $2.2 million from construction costs.

For the developer, that’s huge. Affordable housing is a legal requirement, after all, and its costs are subsidized either by taxpayers (in the case of nonprofit housing) or by market rate renters (in the case of for-profit housing). In this project, the parking requirements add $694 per month to the rent of one- and two-bedroom apartments and $1,042 to the rent of three-bedroom apartments.** Cutting out that cost would be nearly enough to subsidize the apartments on their own. Indeed, it may be enough to improve the ratio of affordable homes to 20 percent or higher.

Another concept that San Rafael should pursue is unbundling the cost of parking from rent. Providing the parking space as a benefit of renting encourages car ownership. Whether they want a car or not, renters would be paying for an extra 270 square feet of space in the garage.

Unbundling would allow car owners to pay for a space to park if they want it and lower rents for those that don’t, putting these homes within reach of more people and keeping more of renters’ money in downtown.

Indeed, there would be a multiplier effect of encouraging car-free living within downtown. People who walk or bike to retail tend to spend more money per month in their own neighborhood. And, by encouraging car-free living, new residents would be incentivized to stay downtown, raising sales tax revenue for the city, reducing traffic costs, and adding revenue to downtown businesses.

Further reductions could be made with transportation demand management strategies, such as providing residents and employees with subsidized Clipper cards and ZipCar memberships, and providing bicycle parking.

This will be a much-needed infusion of new homes to Marin and downtown San Rafael. The city has hardly grown at all in the past five years despite a crushing need for new revenue and new homes. This is precisely the right place, and the right form, for these homes to take.

*San Rafael has a floor-area ratio of 2.0 along Fourth Street, and the three parcels that will be part of the Lennar development have an area of about 59,900 square feet. If we assume the 70,686 square feet dedicated to parking will not be included in the floor area calculation, then the structure will be 119,800 square feet. Given its size, it can be wood frame construction on top of concrete, which costs $119.77 per square foot to construct. $119.77 * 119,800 square feet = $14,348,446.

**This assumes each parking space costs $55,556 to build and a market capitalization rate of 1.25 percent.

Grady Ranch, two years on

With Marin’s housing crisis in the national spotlight, and the Grady Ranch affordable housing proposal light attracting the journalistic moths, perhaps it is worthwhile to revisit the assumptions made when Grady Ranch was first proposed.

In my first post on the subject, widely linked to by opponents of housing, I said of the project:

Development [at Grady Ranch] would be bad by any measure. Car-centric sprawl [such as this] fills our roads with more traffic, generates more demand for parking, and forces residents to play Russian roulette every time they want to get milk. It takes retail activity away from our town centers, weakening the unique Marin character embodied in downtowns...
I respect the efforts of George Lucas and Marin Community Foundation to find a place for the low-income to live, but Grady Ranch is not it. Lucas and MCF need to look at urban infill sites and focus on building up in those areas that are transit-accessible and walkable, places that are actually affordable. Replicating the discredited drive-‘til-you-qualify dynamic in Marin is not the answer; it’s just recreating the problem.

But the calculus has changed. While infill development is far and away the superior path to building more affordable housing, anti-housing activists have blocked every attempt to bring more homes downtown or to retrofit Marin’s drivable places.

In fact, they have actively worked to weaken or defeat opportunities for infill development. With a willful campaign of misinformation they defeated the Larkspur and North San Rafael station area plans. They have beaten Fairfax's planned expansion of downtown into highway commercial zones to within an inch of its life with the same tactics.

All the while, these same anti-housing groups have done little or nothing to advance their stated agenda of more second unit homes. They were absent when the Novato Water District pushed for massive fees on secondary water hookups, leaving it to CALM and MEHC to defeat the proposal. They have not tried to broaden acceptance of housing vouchers by private homeowners, have not pressed for reduced permitting fees, subsidized construction, or a lift of off-street parking requirements.

So without new infill development, without new second homes, and a mounting crisis, there is no other place for homes to go except the greenfield.

This is not a philosophical position, but a pragmatic one. The affordable housing waitlist is over a decade long. Our seniors are living in storage units, and our families are living in their cars. The crisis has only gotten worse in the past two years, and the politics have not improved. Affordable housing advocates, though firm believers in smart growth, should not stand idly by while our crisis deepens.

In other words, by throwing up roadblocks to development that will generate comparatively little traffic or strain municipal budgets, housing opponents have forced advocates to make a gut-wrenching choice between the relative well-being of Marin's worst-off and the practices we know will make for a better built environment in Marin. Opponents of housing will get the highest impact development possible because they have made it impossible to build anything else. Nobody is happy about that.

As I also said two years ago, "[E]ven if Grady Ranch is an irredeemable project, that doesn’t mean the end result can’t be less terrible." Grady Ranch is now in the planning phase, and there are myriad ways to reduce driving trips and promote connectivity for the new residents there. Advocates should dust off their New Urbanist hats and dive in to provide guidance on how to reduce trips and automobile dependence at Grady Ranch.

Grady Ranch really is all wrong, but doing nothing would be even worse.

Will anything ever change?

With the death of Aura Celeste Machado on Point San Pedro Road still fresh in our minds, neighbors and safe streets activists are again calling for traffic calming on the high-speed thoroughfare. But they did the same two years ago when a driver killed Hailey Ratliff on her way home from school in Novato, and there were no substantial changes. Others rallied when a driver killed Olga Rodriguez on Heatherton in San Rafael last year, but nothing changed there, either. Will Celeste’s tragic death be the last straw?

Celeste was jogging around a fallen tree that hadn’t been reported to city maintenance workers when a driver hit her. Though she wasn’t killed instantly, doctors said she wouldn’t recover consciousness and her parents made the heart-wrenching decision to remove her from life support.

The section of road where she was killed is thickly peopled, with residential neighborhoods rising into the hills on one side of the road and commercial and other services descending on the other side into San Rafael Bay.

It is also a high-speed divided thoroughfare, with freeway-width lanes and a median barrier. The posted speed limit of 35mph means a typical speed of 40mph, and the forgiving roadway design means speeds of 50 and up are easy to imagine.

The speed and the design that facilitates it are important factors. At these speeds, any mistake by someone driving or someone walking is likely to mean death or life-changing injury for the person on foot.

Activists working with the elementary school have been trying to get a stop sign installed for years to no avail. A stop sign is the easiest form of traffic calming on a road like this, as it slows traffic down for a considerable distance around the sign as drivers decelerate and accelerate. It works well on D Street, as it slows drivers who have come down off Wolfe Grade on their way to downtown San Rafael.

We don’t know if a stop sign would have saved Celeste, but it would certainly have improved her odds. Though a collision at 40mph means almost certain death, a collision at 25mph rarely results in death.

The pessimist in me says nothing will change. We will pour out sympathies, again, and cry over the life cut short, again, but then still prioritize high-speed traffic over lives and safety.

I hope we can do more than shed crocodile tears.

Marin’s traffic in the decline – except at peak

On Marin’s roads, driving is down, daily traffic is down, and morning commutes are worse. The odd and seemingly contradictory data helps shed light on some of the core problems of congestion and travel in our county, and helps us confirm (and dispel) some myths about the state of driving.

Introduction to the data

On state and federal roads in Marin (highways 1, 37, 101, 137, and 580), Caltrans keeps track of average daily traffic volumes over the course of a year, average daily traffic volumes in the busiest month, and peak hour traffic volumes.  The latest dataset is from 2013, and there’s no data for 2009 or 2010.

California’s Air Resources Board (ARB) keeps track of the vehicle miles travelled, or VMT, throughout the county. When combined with data such as number of vehicles and number of people, we can know how many miles the average driver puts on their vehicle.

Broad trends

The broadest trend in Marin is faster traffic growth at the peak hour than during the rest of the day. This is most pronounced in Highway 101 north of Larkspur, where peak volumes rose an average of 9 percent between 2012 and 2013 while daily volumes are essentially flat.

This strongly implies people are driving to work more, that work is further away, and that more people are commuting to Marin from other counties.

Data from the ARB and Census backs up these hypotheses. Per capita VMT and trips per day has declined substantially since 2000 even while average distance to work has climbed, both for Marin’s working population and its workforce.

Trips per capita have seen steady declines since 2007, while VMT has only perked up in the past two years since its high in 2002.

Travel distance has continued to grow,at the expense of the shortest commutes under 10 miles.

Localized trends: Tam Valley

Perhaps nobody’s traffic has received such attention than Tam Valley’s. Complaints about Muir Woods tourists clogging local roadways have become integral to the neighborhood’s politics, but Caltrans data doesn’t quite bear out this narrative.

While travel to Muir Woods grew over the past five years, it actually declined in 2012 and 2013. As well, despite the overall growth, drivers diverting to Panoramic Highway – the access road to Muir Woods – only account for about 7 percent of peak-hour traffic at Tam Junction, the main intersection. Even during peak season, just one tenth of daily travel is to Panoramic Highway. The real growth comes from Mill Valley’s rush hour.

Commuter traffic coming from Mill Valley down Almonte Boulevard grew 23 percent from 2012 to 2013, a huge jump in an area with terrific backups. This is in spite of a 6 percent decline in daily traffic volumes at Tam Junction over the same period.

If tourists were the reason for the traffic backups today, volume would need to have spiked by 20 percent in 2014 to return to the high of 2011, which was long before the current ruckus over tourist traffic began.

Localized trends: Tiburon

Traffic is way, way down on the Tiburon Peninsula’s Highway 131. Between 2001 and 2013, volumes dropped by as much as 40 percent, or an astounding 19,000 cars per day. Rush hour traffic didn’t drop quite as much, but a 9 percent fall is nothing to sneeze at.

This fall fits almost perfectly with the decline in jobs and workers on the Tiburon Peninsula. According to LODES, the number of workers commuting out of Tiburon dropped by about 10 percent between 2001 and 2011, and the number of workers commuting in dropped by about 9 percent.

Localized trends: Highways 101, 37, and I-580

Marin’s spinal Highway 101 can be broadly split in two: the area south of the 580 Junction and the area to its north. Beyond the cultural differences between Northern and Southern Marin, they have different commute sheds, with northerners more likely to commute to San Rafael, and more likely to endure traffic from Sonomans, than their southern compatriots. Between 2001 and 2013, rush hour traffic grew slower and daily traffic fell south of 580, the opposite of what was occurring north of 580.

I-580 is undergoing similar transformations, with rush hours growing much faster than daily volumes. Though travel on all modes was essentially flat between 2011 and 2013, between 2010 and 2011 the rush hours grew mightily, heavily weighted toward the 101 junction. Between the 101 junction and Sir Francis Drake rush hour volumes grew an average of 27 percent; to the east of Sir Francis Drake, rush hours grew by just 12 percent.

Part of the reason for the growth in Northern Marin – though by no means all of it – is the significant added volume on Highway 37 to Solano County. While rush hours were once comparable to Highway 1, rush hour volumes are up 17 percent, and daily travel is up by a similar amount.

The growing importance of San Rafael as a jobs hub for Sonoma and Northern Marin is likely the cause of worsening rush hours on all three roadways.

Policy implications

Given the growing importance of San Rafael as a commuter destination, it is more important than ever for that city to do what it can to reduce the demand to drive into its downtown from the north, and for Sonoma’s transit agencies to treat it with the same seriousness GGT gives to San Francisco.

The lowest-cost policy for San Rafael and for the County is to aggressively approach the problem of parking as part of a broader transportation demand management scheme. Important to that would be to eliminate parking minimums downtown, establish parking permit districts in the surrounding neighborhoods to prevent overflow, and price street parking sufficiently to ensure there’s always a space available on the block where you want to park.

The location of growth in 101 traffic speaks to the importance of SMART in alleviating traffic congestion. 101’s 14-15 percent growth in peak hour traffic (really both of the two-hour morning and evening rush hours) heading to San Rafael from the north amounts to only about 500 cars per rush hour. Given how much a difference these extra cars have made to Northern Marin commutes, diverting an equivalent number of trips to a train would be a major boon.

Highway 37 is a sticky wicket. Widening the road would simply add congestion to 101 and encourage it near Vallejo. Congestion pricing and buses would be a far cheaper and more immediate solution. The ongoing study of travel along Highway 37 should incorporate both of these.

In Southern Marin, the travel demand from Mill Valley to San Francisco has already made Route 4 one of the most productive in GGT’s system. Further boosts to transit through that corridor will pay off, especially measures to allow buses to bypass the heinous backups.

Conversion of general travel lanes on 101 south of Marin City to HOV lanes would likely pay off upstream. Encouraging people to carpool or take faster buses – and there is no such incentive for Southern Marinites today – will mean fewer vehicles at the various chokepoints like Tam Junction.

Finally, while the drop in traffic around Marin is welcome, if travel isn’t replaced by other modes it’s a worrying sign for Marin’s economy. Cities and the county must invest in their protected bicycle infrastructure. Studies in comparable locations around the country have found people arriving by bike are much better customers for downtown businesses than people arriving by car. Marin is well-primed to take advantage of that fact, with its vibrant mountain biking scene and walkable town centers.

The siren songs of wider roads and a housing moratorium

The reflex is to forego all this transit-and-biking mess and push for more roads, or to call for a moratorium on housing. Both would be foolish.

It has been known since the 1930s that more roads simply fill up with more cars. Widening 101 at the Novato Narrows is expected to displace congestion from the Sonoma/Marin border to Central San Rafael. Widening 580 will only encourage more people to swap their Bay Bridge commute for a Richmond Bridge commute.

Housing moratoria won’t work either. Rush hour traffic has grown far, far faster than population. San Rafael and Tam Valley have seen almost no housing growth in the past five years but have seen stupendous rush hour traffic growth. There needs to be a plan to reduce driving demand among Marinites. Reflexively calling for a housing moratorium is misidentifying the problem, pointing the finger outwards when Marinites themselves are the cause of the problem.

Opponents of housing have floated an innovative idea: remove parking minimums from local development codes. If properly sited and blended with local retail, this housing could actually facilitate a drop in traffic. Portland conducted a comparative study of transit-oriented and car-oriented developments and found that the number of car trips diverted was far greater than the number of new transit trips. The authors speculated this was because more people were able to walk or bike from home for their daily errands.

A housing moratorium, then, is bad medicine from a misdiagnosis of the problem. Rather, Marin needs a parking moratorium. Coupling that with the transportation alternatives listed above could prove a sea-change in how Marin gets around, and may put a halt to the rapid rise in traffic.

San Rafael needs a progressive replacement for Nader Mansourian

First up: if you’re interested in becoming a new Director of Public Works for a small city, apply by the end of today.

Downtown San Rafael. Image from the Business Improvement District.

For years, San Rafael has been something of a mixed bag to Marin’s suburbanists. On the one hand, its downtown is the most transit-accessible places in the county. On the other, the network of one-way streets and pedestrian barriers – especially on Second and Third – have rendered large swathes of the city no-go zones for pedestrians.

With Nader Mansourian’s retirement as Director of Public Works in March, San Rafael has a chance to hire someone who makes moving people a greater priority. If I were a member of the city council, I would ask candidates the following questions:

1.       What do you believe the role of a city’s streets should be? The answer I’m looking for: for moving people, and for building the community's wealth. The answer I’m not looking for: to move vehicular traffic. The first answer indicates the candidate understands that traffic and street problems are more than just engineering issues around traffic flow. There are competing priorities for city streets.

The second answer indicates the opposite, that moving cars, regardless of the occupancy, is more important than pedestrian safety or encouraging more efficient use of the street network.

2.       What do you think of the NACTO standards? NACTO design guides have become one of the most important parts of building complete streets. They include scientifically evaluated standards for safe bike lanes of all types; for transit-only lanes; for arterial roads; and others.

Caltrans has endorsed NACTO's guides. Having a new director that embraces this shift is vital for the city.

3.       What do you feel the city can do to improve pedestrian safety? Roadways and pedestrian safety are more than simply a compact between people in cars and people on foot. Design can have a subtle and subconscious effect on driver and pedestrian behavior.

The most obvious results of Mansourian’s safety efforts are scores of Do Not Cross pedestrian barriers and the removal of the crosswalk at Third and Cijos. He largely didn't make use of the other, more subtle and effective tools in the toolbox.

San Rafael desperately needs a progressive in charge of its infrastructure, especially its streets. Mansourian was a highly effective engineer, but he was hidebound to outdated standards that run against the grain of modern best practices. San Rafael needs change. You should apply – applications are due at the end of the day.