Polishing poop: the SMART schedule

Update: SMART just reached out to me with news that they are looking at the schedule again based upon the feedback they've received, so stay tuned for a new schedule.

By now, word of the final SMART schedule is out, and the response is relatively negative. The schedule (PDF here) has a 90-minute gap right at the heart of the rush hour, between 7:26am and 8:56am. Folks were not having it on Twitter. These two tweets are fairly representative:

The SMART Board wasn’t happy with the results either. San Rafael Mayor Gary Phillips told staff at the meeting where the schedule was released, “With these kind of gaps I’m concerned people will say, ‘I’ll continue to drive my car,’ I would encourage we revisit this” (1).

For their part, SMART spokeswoman Jeanne Belding wrote me indicating the schedule was a result of a survey of potential riders after a draft schedule was released. She added, “The schedule we are opening with is based on previous feedback, our staffing, and takes into account the fact that we have a single-track system” (2).

SMART General Manager Farhad Mansourian indicated that the reason for the schedule is, in short, that it is complicated: with the system running as it is, a change to one train means all trains must be changed. And there’s freight trains to deal with, only four active passenger trains, and so on (1). But I think there is more to discover in the schedule, and that the system is not nearly as hamstrung as GM Mansourian seems to indicate.

Polishing poop

Let it be known that just because the schedule is bad doesn't mean SMART isn't operating under real constraints. Undoubtedly, this was someone's attempt to polish the poop (or shine the shit) that is their situation. Nevertheless, this is definitely not sufficiently shiny yet, and I think we can do better. Let's look under the hood at what we're dealing with.

First, we can divide the schedule into a series of what I call platoons: four trains, each departing 30 minutes after one another, followed by a minimum of a 90-minute break, followed by another platoon. These are set by the number of trains SMART can run at any given time: just four of their seven-train fleet. Spokeswoman Belding told me they have had trouble hiring drivers, citing the high cost of living as the reason, and so they are limited to just four trains on the tracks at any given time. She did not answer a question about when they expected to be at full strength (2).

Another limiting factor are the passing tracks. Taking best practices from Switzerland and Germany, SMART built a single-track commuter system with four four-mile-long passing tracks at key locations so trains could run in both directions and pass one another. The problem, of course, is that these passing tracks limit the schedule to certain ranges. What those ranges are, SMART can’t say, but we can assume that the schedule as presented is one solution.

Taking all this into account, we can trust that changing one train’s arrival or departure time more than a few minutes requires the rest of the schedule to be changed by the same amount.

Alternatives

So now, the problem at hand: what to do about that 90-minute morning gap.

I took this as gospel and rotated the entire schedule around the arrival time of Train 5 at downtown San Rafael. Here’s what I call San Rafael Rush:

The San Rafael Rush schedule gets everyone to downtown San Rafael before 9am and ensures people still have time to walk to work after the last train arrives. Unfortunately, it makes things tough on northbound commuters, giving very little flexibility for Marinites working in Sonoma.

The second option is what I call Early Bird:

This option pushes everything back by about 10 minutes, ensuring that the 90-minute gap ends right as rush hour is at its worst. I’m not so keen on Early Bird, as few people arrive at work during those early morning hours served by the first platoon, but it does make sure that people can at least get to the office by 9am.

There are other methods of making the schedule fit, but it’s important to understand that SMART is operating in a tension between what riders say they want versus what the data says they should do. Census data shows what we know: that a plurality of people working in San Rafael arrive between 8am and 9am, people whom the current schedule poorly serves. SMART also insists that its schedule is based upon feedback from its own scheduling poll of potential riders.

It’s also important to note that GM Mansourian’s statements that nothing can be done are obfuscation. True, SMART is limited in its schedule movement, and they will be until they get the drivers they need, but they can indeed do better than what they’ve given. There is a bit of hope on that front. The GM indicated they’d be open to changing the schedule based on feedback after the train has started running. “This is what we will test and get feedback. If we can tweak, we will tweak” (1).

PS - And just because you've heard it a thousand times already, I did promise to remind you not to risk getting hit by a train. Sure, they'll be far less dangerous than drivers, but that doesn't mean you want to be the guy making everyone late for work because you got squashed by a train. Also, I will take this opportunity to repost one of my favorite ads, Dumb Ways to Die.

Works cited

(1) Prado M. SMART schedule has major service gaps. Marin Independent Journal [Internet]. 2017 May 17 [cited 2017 May 22]; Available from: http://www.marinij.com/article/NO/20170517/NEWS/170519805

(2) Belding J. Service schedule & trains. 2017.
Election Maps for November, 2016

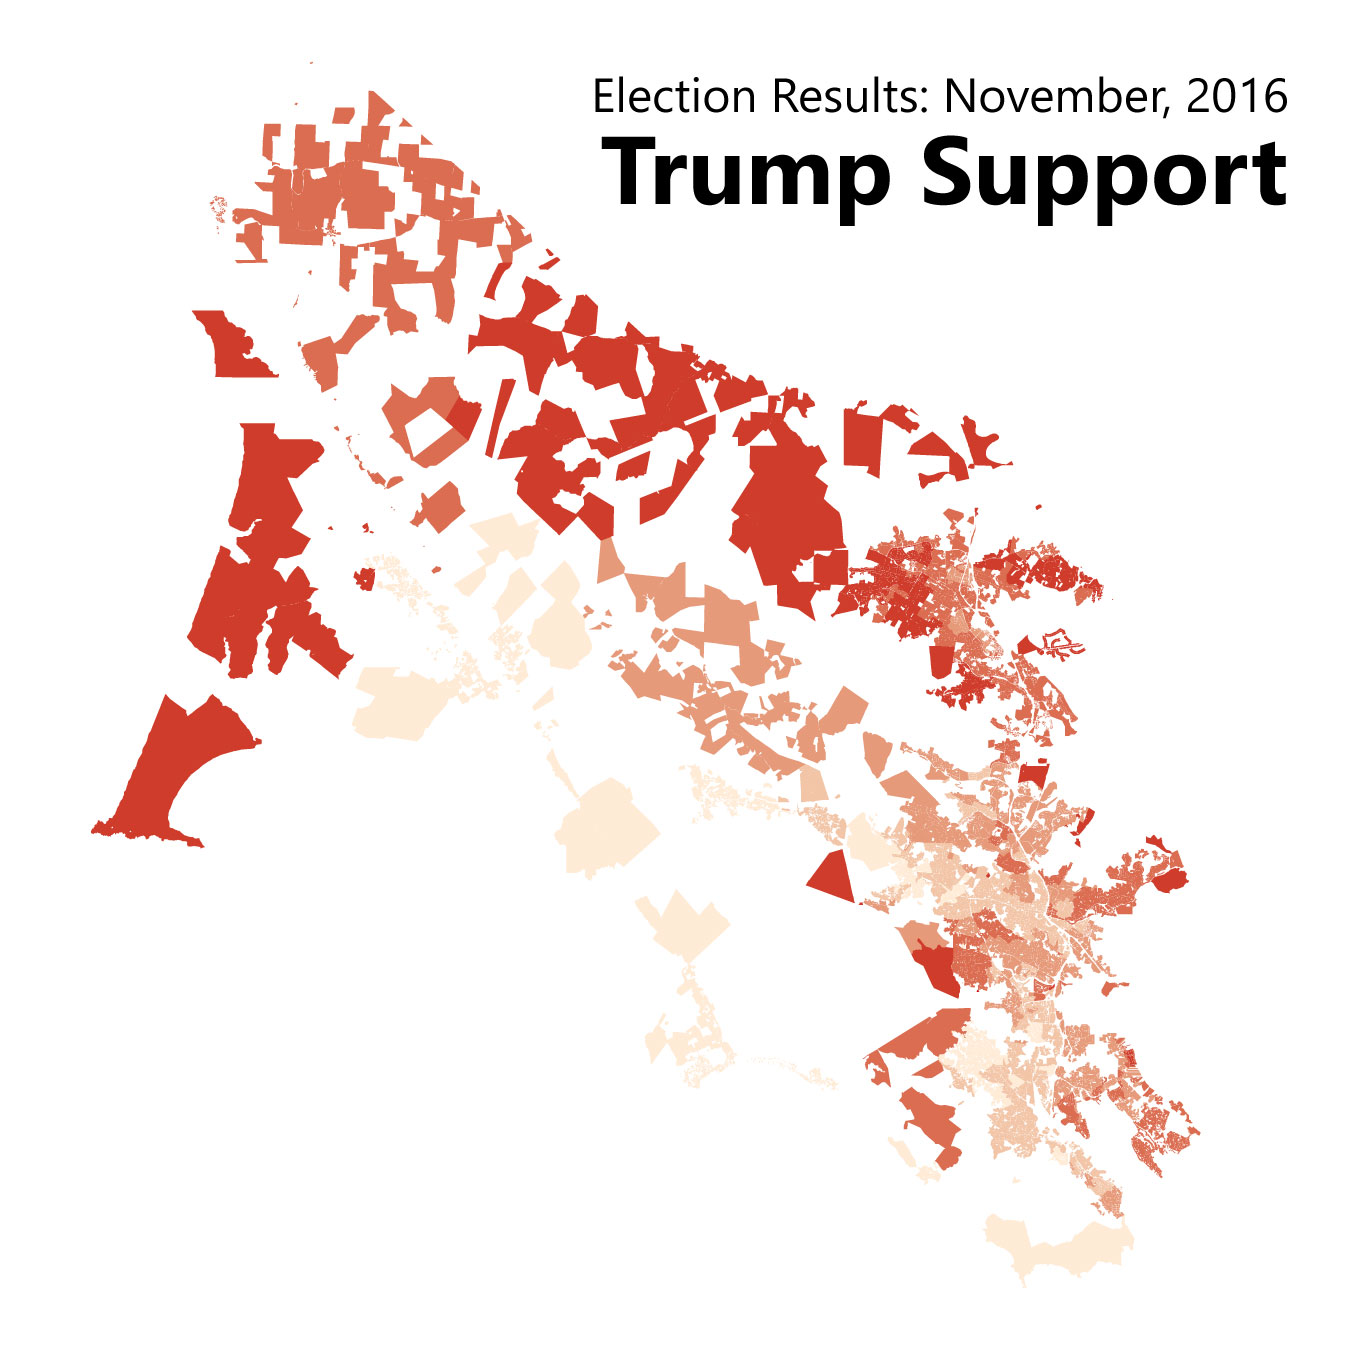
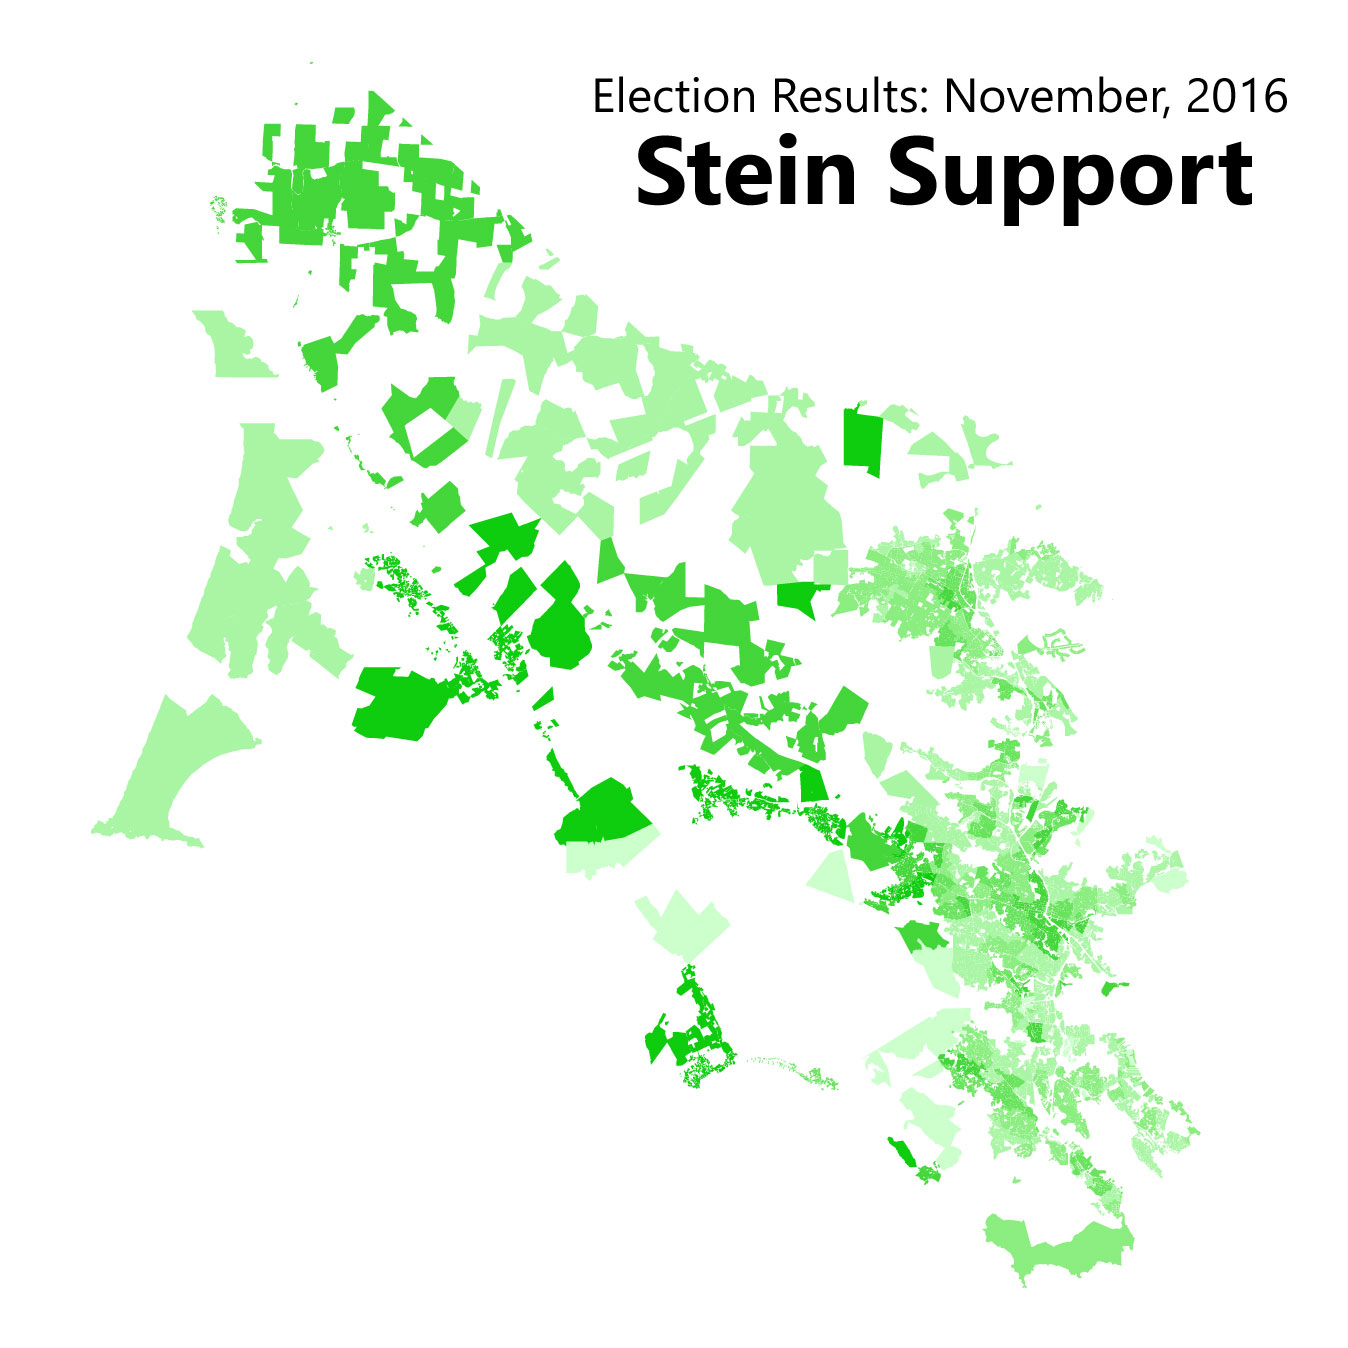
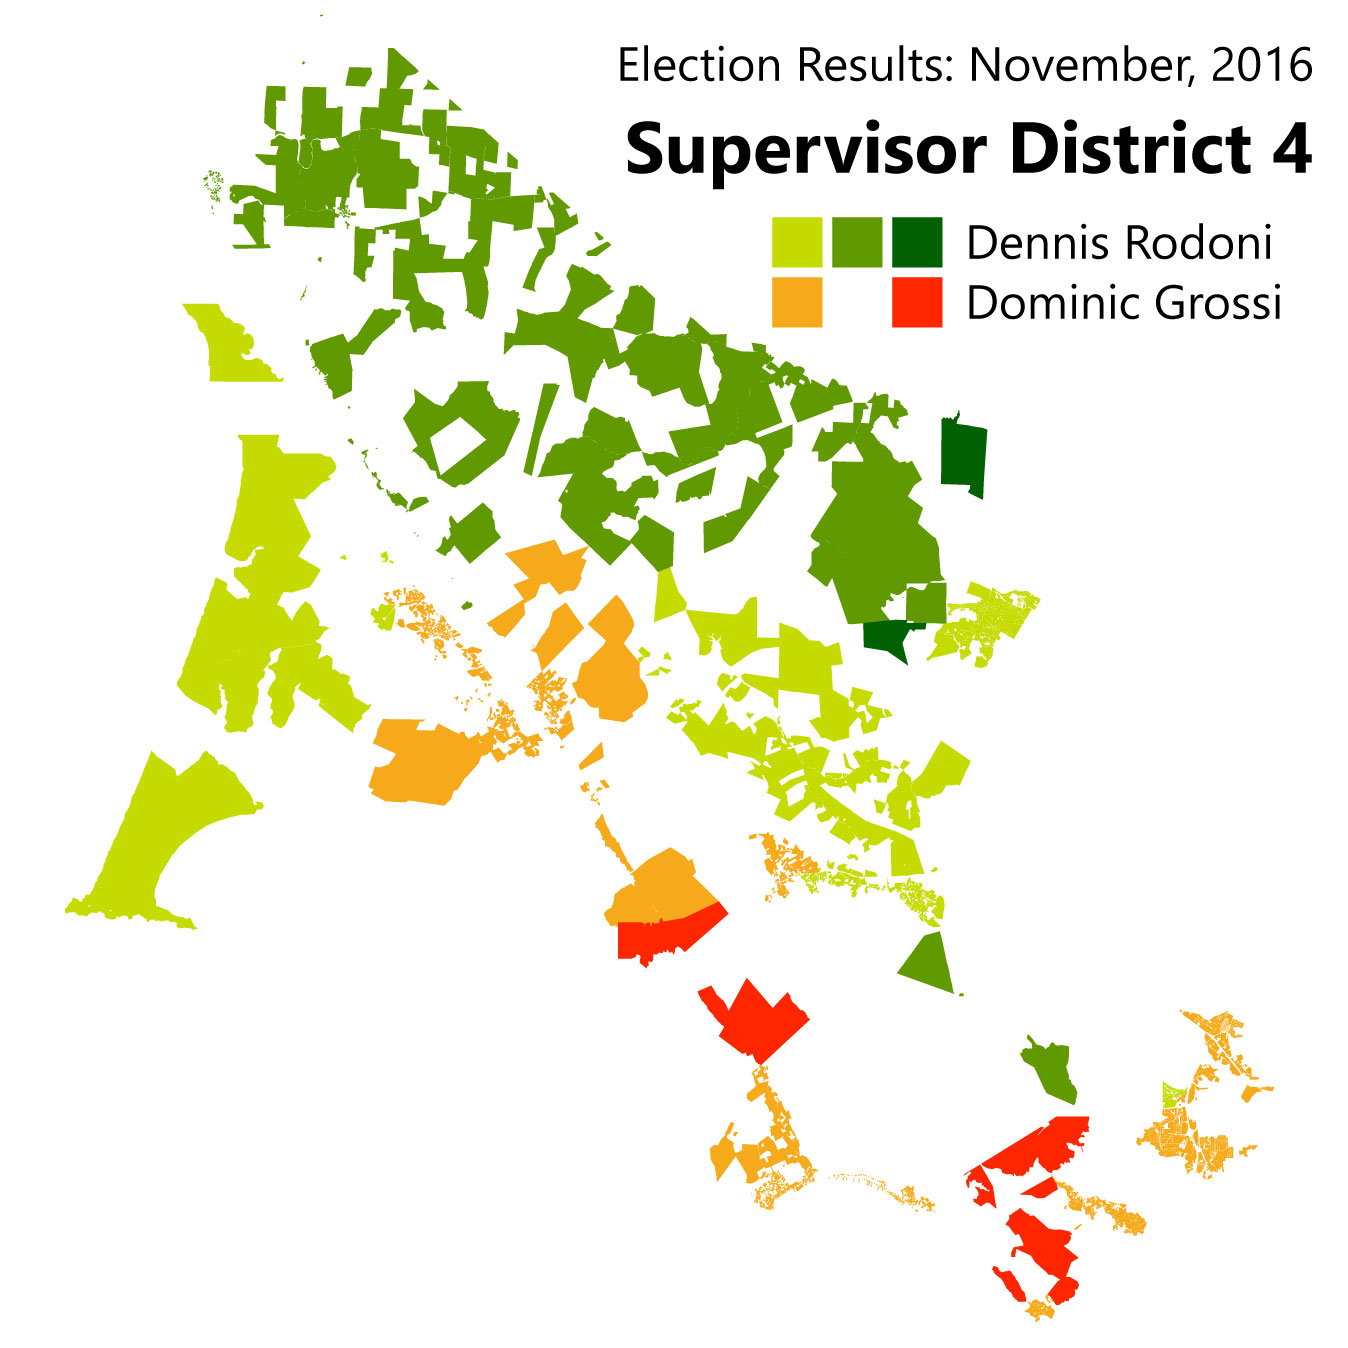
As anyone who follows American federal politics knows, location can mean a lot when it comes to who votes for whom. Electoral maps on the local level are rather more rare, but no less informative. Here below are the maps of relative support for selected races and candidates from the November 2016 election. (1)

(You can click on the images for a bigger size and the PDFs are available, too, by request. Feel free to request more maps in the comments section. Note that this is not the final tally but one of the interim tallies. The exact levels of support may change a bit.)

President

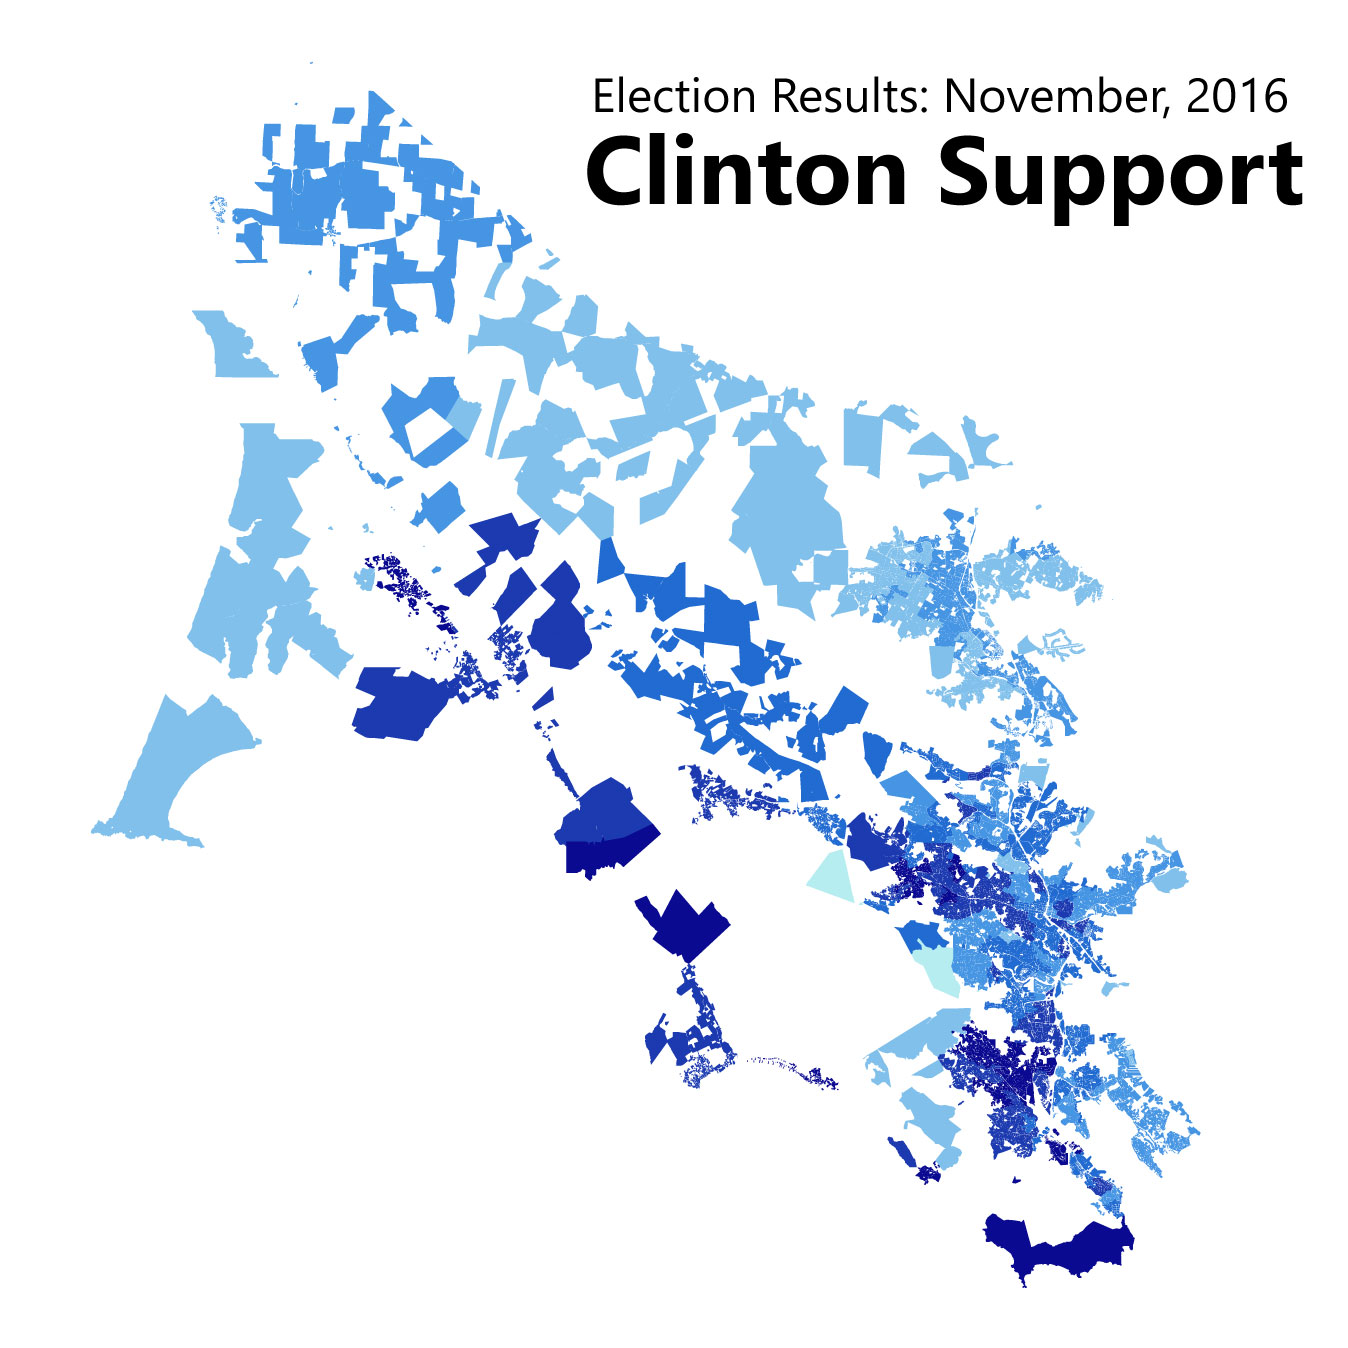
Hillary Clinton won every single voting precinct in the county with at least 52 percent of the vote and Donald Trump got second place in all but two precincts, each of which are worth less than 100 voters. Rather than map first and second place, then, I wondered how the voting was distributed across the county.

Tiburon, Blevedere, Ross, Corte Madera and Novato were the most conservative of Marin's cities, though in Marin that means voting for Clinton with 55-65 percent of the vote rather than 80 percent. Jill Stein did best in West Marin's villages and downtown San Rafael, and Trump did his best in Novato.

District 4 Supervisor

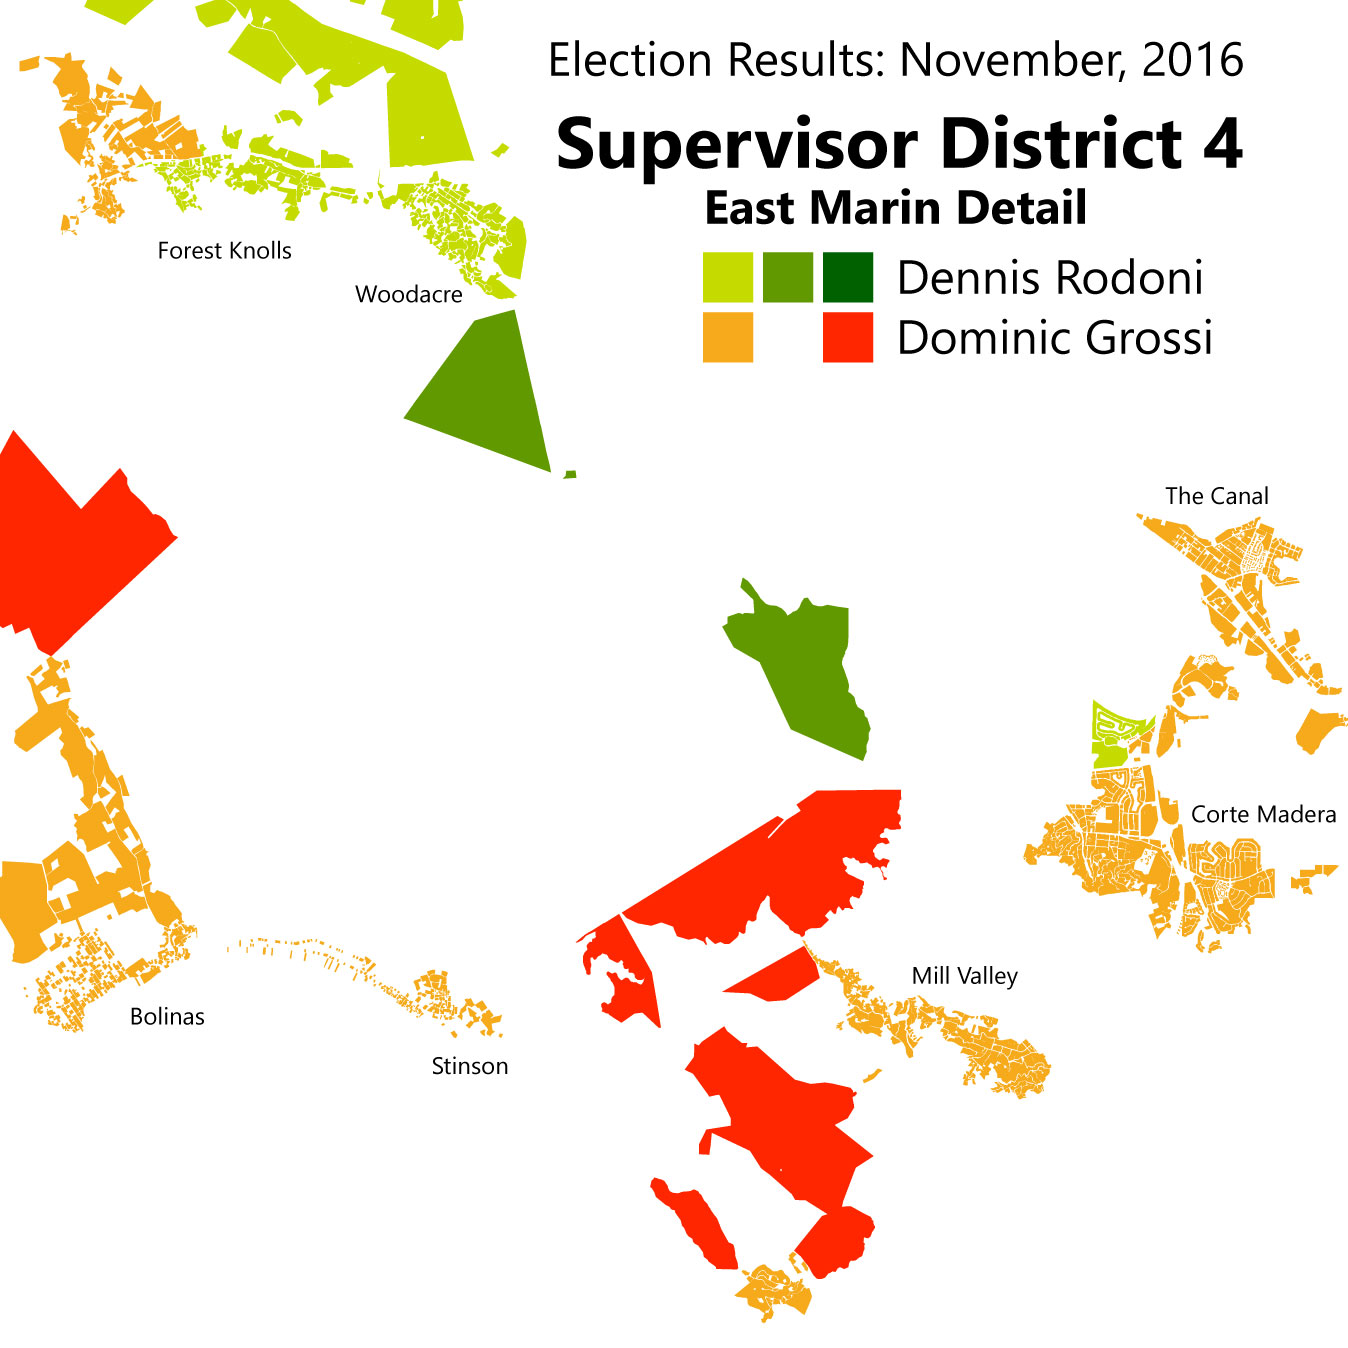
In Marin's marquee election, Dennis Rodoni beat out Dominic Grossi in second-round voting. Broadly speaking, Rodoni carried the northeastern half of the district with broad-based support in Woodacre, Dillon Beach, Novato, and a slice of Larkspur. Grossi took the district's southwestern half, getting support from San Rafael, Corte Madera, Mill Valley, and a handful of West Marin villages.

This mirrors the support received in the first round, indicating to me that there was not much convincing going on in the latter half of the campaign.

Proposition 64: Marijuana Legalization

As with Clinton support, no precinct in the county rejected the measure. That said, we can see that support for the measure largely followed the same lines as the presidential race: places that were cooler on Clinton were cooler on legalizing pot, and vice versa.

2016.11-Prop64-Support.jpg

Measure A: "Strong Start" quarter-cent sales tax for child services

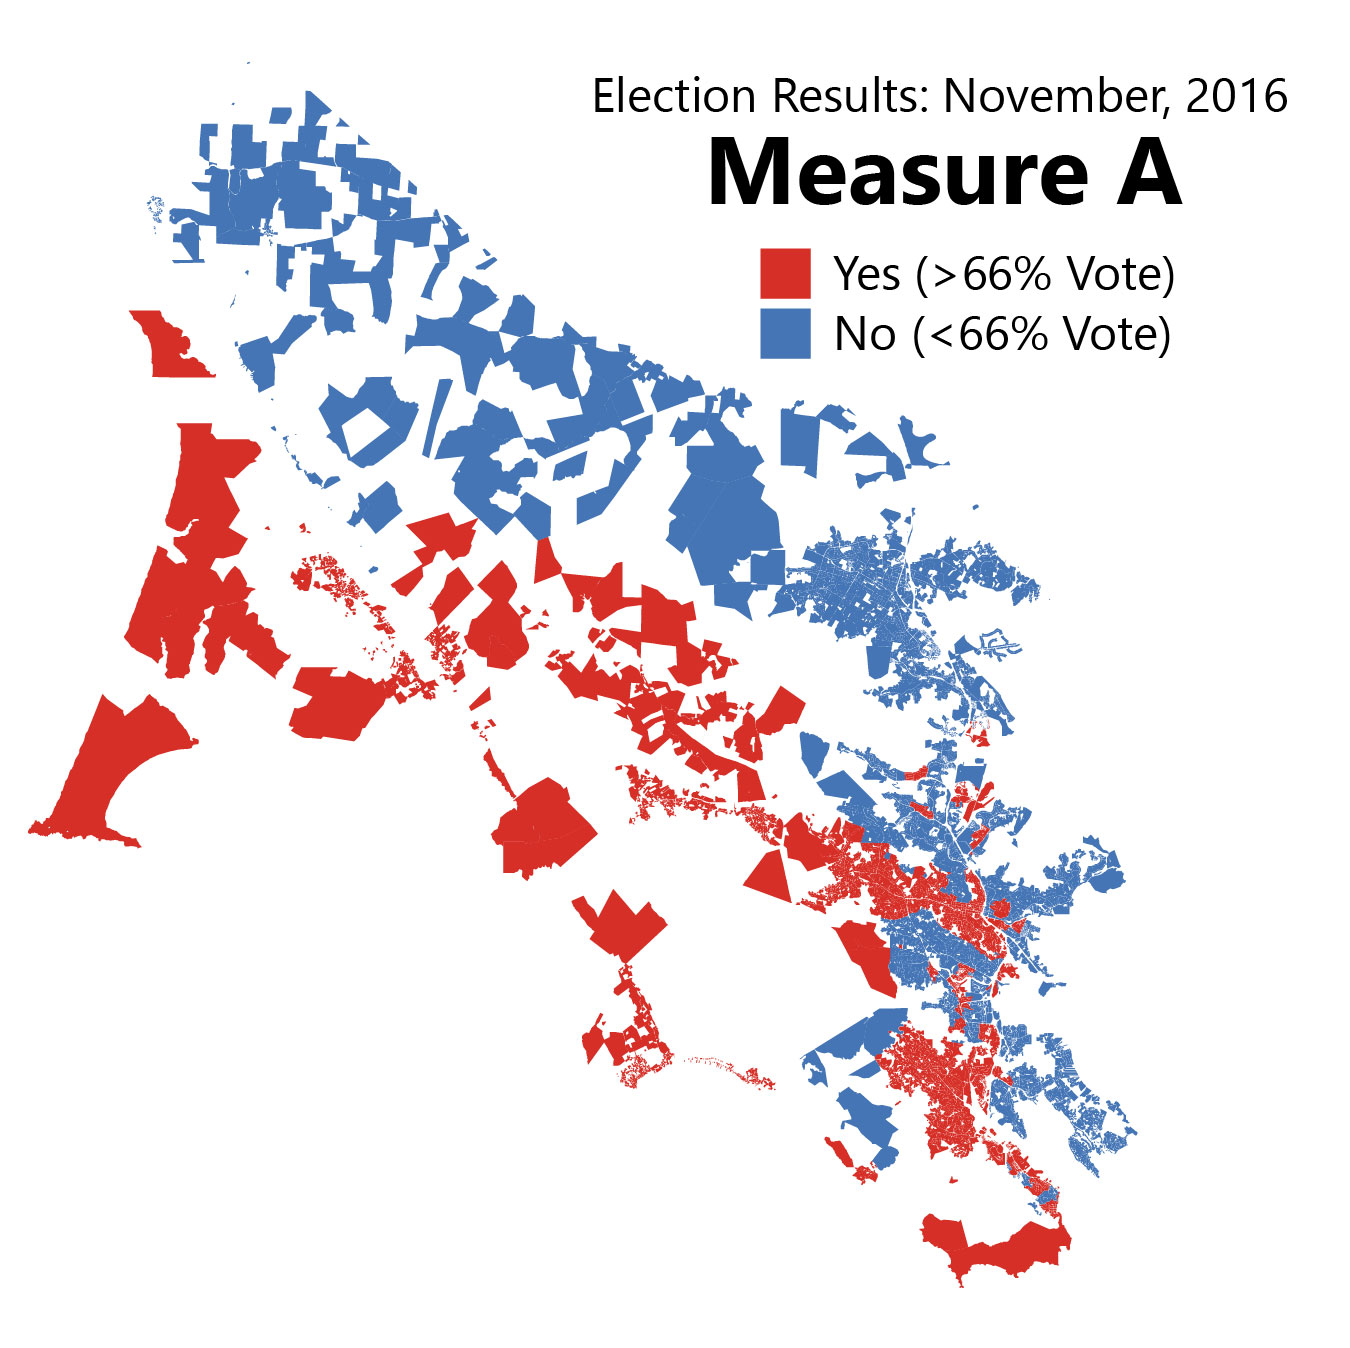
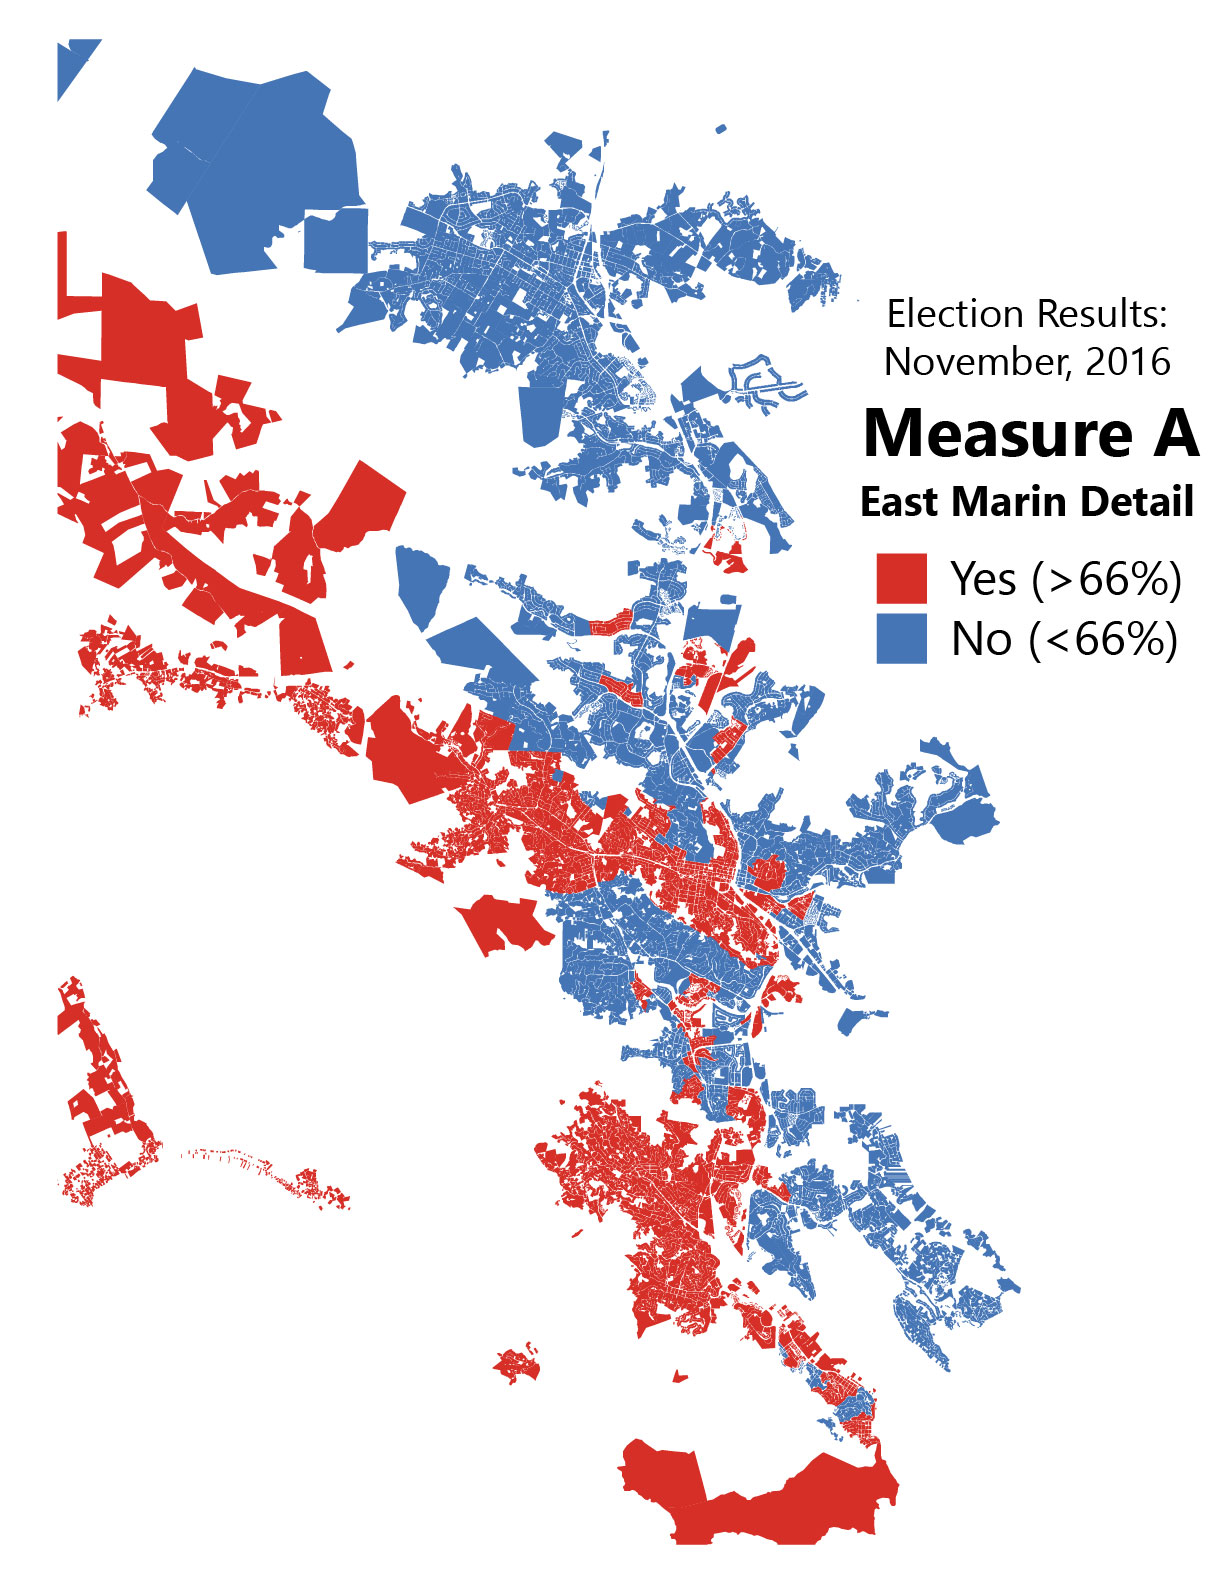
Marin's marquee ballot initiative was much more divisive. The measure, which would have passed a quarter-cent sales tax "to fund expanded preschool, child care and health services for low-income children in Marin," (2) did not pass. Though no precinct had less than half its voters supporting the initiative, because it was a new tax it needed a two-thirds majority. There is some of the liberal/conservative split seen in these results, but at first glance it looks bit more ambiguous than in the presidential election.

Look under the hood, however, and one finds a significant correlation between Clinton support and Measure A support. Here's that scatter-plot:

Basically, for every percentage of Clinton support in a precinct, that precinct also saw a half-point more support for Measure A. That's not a one-to-one match, but it is definitely there.

So Marin does seem to have something of an ideological split. Indeed, it may be possible to use Republican and ballot measure voting patterns to mark which areas are more or less liberal than the Marin County average. What to label this divide, of course, would be quite heated: both sides want to seem mainstream (and both are!) and being "conservative" in Marin is almost seen as a character flaw. Chime in in the comments if you have ideas ("populist" vs "progressive" or something?)

The core message of this post is that Marin does have politically diverse geography beneath the liberal veneer. Understanding it should be integral to any political outreach program.

1. Marin County Elections Department. November 8, 2016 General Election Statement of Votes Cast [Internet]. 2016 [cited 2017 Feb 7]. Available from: http://www.marincounty.org/depts/rv/election-info/past-elections/page-data/tabs-collection/2016/nov-8/sovc-listing-page

2. Halstead R. Marin voters face 11 tax measures on November ballot. Marin Independent Journal [Internet]. 2016 Aug 12 [cited 2017 Feb 7]; Available from: http://www.marinij.com/article/NO/20160812/NEWS/160819921


Returning to the Flood

Last week, San Anselmo came within inches of yet another disastrous flood. Perhaps it’s time to revisit the flood detention basin issue.

Background

After the flood in 2005, a plan was put forward to build a flood detention basin in Memorial Park which would protect the downtown from floods by temporarily diverting water to the park during heavy storms. The town received a $8.72 million state grant to build the $17.2 million basin and planning work began. In 2015, voters rejected Measure E – without downtown’s support – which would have allowed the use of Memorial Park as a basin. The flood zone board is now trying to figure out what to do instead.

Support for Measure E. Image by the Author.

Of those currently on the council, Matt Brown and Ford Greene oppose the conversion of the park. Councilmember Brown led the charge to pass Measure E. In the same election he also ousted now-former council member and basin supporter Doug Kelly. Councilmember Greene has consistently sided with Marin’s populists on issues such as affordable housing, zoning reform, transit, and the flood basin. Both have appeared at Citizen Marin and associated group meetings. The rest of the council (Kay Coleman, Tom McInerney, and John Wright) supported the conversion of the park [1] and presumably still would if it were a possibility.

Councilmember Brown is certainly unmoved by last week’s close call. To quote the IJ, “Brown said he and many other San Anselmo residents wisely chose not to buy property in the floodplain. He said spending millions of dollars to address flooding in the Ross Valley would be ‘tantamount to a bailout of somebody’s real estate decision.’” He also voiced skepticism that the town should even pay for flood mitigation: “[H]ow how much are we willing to pay to put that plan into place? This is a multimillion-dollar project, one that I believe the people have to decide if it’s worth implementing.” [2]

Councilmember Greene doubts that the basin system would even make a difference but advocates instead for another basin in Fairfax and the demolition of 636 San Anselmo Avenue, which straddles the creek. [3] This is one of the proposals currently undergoing public comment.

What now?

The basin would have been part of the work plan for Flood Control District 9, the board charged with reducing flood risk in Ross Valley, but the rest of the work plan is still proceeding. This includes raising bridges in San Anselmo, Ross, and Fairfax; creating flood detention basins at Loma Alta and Lefty Gomez Field in Fairfax; creating additional storage capacity at Phoenix Lake; and improving the creek channel in Ross and Larkspur. [4] The conversion of Lefty Gomez Field has already inspired opposition. [5]

Of course, the Memorial Park basin was part of the overall flood mitigation strategy for the watershed and, with its demise, an alternative needs to be found. There are four alternatives currently before the district board, each of which costs approximately the same as the Memorial Park conversion. You can read all about them here, but the gist of them is that each would be disruptive somewhere. The No Basin Alternative involves heavy roadwork on the Sir Francis Drake Boulevard bridge. The Sleepy Hollow alternative involves a detention basin at Brookside Elementary. Councilmember Greene’s preferred alternative would involve at least partially demolishing two of downtown San Anselmo’s iconic buildings. [6]

It is a shame that downtown San Anselmo has to endure not just neglect from its neighborhoods but active opposition to its success. A town ought to be more than a commodity to be used but a community that sticks together and looks out for one another. Downtown is supposed to be the heart of that community.

Works Cited

[1] Richard Halstead, “Dueling Ballot Measures over Flood Control Divide San Anselmo,” Marin Independent Journal, September 26, 2015; Peter Seidman, “Shelter from the Storm,” Pacific Sun, May 4, 2015.

[2] Richard Halstead, “Ross Valley Flood Scare Brings Calls for Action,” Marin Independent Journal, January 13, 2017.

[3] Ibid.

[4] Marin County Department of Public Works, “FZ9 Project Fact Sheets,” Marin County Watershed Program, accessed January 18, 2017.

[5] “Save Lefty Gomez Field,” accessed January 18, 2017.

[6] Liz Lewis, “Update-Analysis of Replacement Project Alternatives for DWR Grant” (San Anselmo, CA: Flood Control Zone 9 Advisory Board, June 21, 2016).

A high-frequency SMART corridor, revisited

In this week’s IJ Forum, guest and transit skeptic Richard Hall brought up something I didn’t expect: the argument that transit frequency equals freedom [1]. This is something that transit advocates have been harping on in Marin and elsewhere for years, and one of the key factors that is likely to hold back SMART from reaching its potential. Though I addressed this point back in 2012, with the train opening up this year it is worth revisiting how SMART might be able to reach higher frequencies, and how much it might cost.

There is blood in the single-track stone

Once operational, SMART’s trains will run in both directions simultaneously despite having only one track. It can accomplish this through the judicious use of passing tracks, meaning a strategic stretch of the corridor will be double-tracked so trains can pass one another.

At full build-out, from Cloverdale to Larkspur Landing, there will be 4 such passing tracks, each of which is 12 miles long, which will allow trains to run every 30 minutes in either direction. (This 30-minute time is called the “headway” in transit-speak.) To double the frequency to 15 minutes, we would need to double the number of passing tracks to 8. To double frequency again to 7.5 minutes, we would need to double the number of passing tracks again to 16.

At this point, the permanently single-tracked Puerto Suello Tunnel between North and Central San Rafael becomes the choke point. Any further increases would need to widen the Puerto Suello Tunnel and basically double-track the whole system. This would likely overkill for the foreseeable future.

Using the existing construction costs as a guide, the cost for the passing tracks on a 15-minute headway system is $60 million. The cost for a 7.5-minute headway system is twice that: $120 million [2]. If we include the cost of the trains needed to run such frequent service, the total cost would be $120 million and $307 million, respectively [3].

We can squeeze blood out of this stone if we are willing to spend the money for it.

Of course, ridership at this point becomes a problem. Is it worth it to run trains this often? Definitely.

There are almost 43,000 jobs and over 19,000 people within a half-mile of SMART’s stations. 2,237 people live and work within the station areas [4], but commute trips account for only about 20 percent of all trips, and this doesn’t include people who might use the park and ride services. Ballpark figures, using a ridership model [PDF] from the Transportation Research Board put the ceiling of SMART’s potential ridership at about 25,000 [5]. SMART itself estimates its ridership will be around 4,500 trips per day, which the model agrees with.

We need to dive a little bit into some wonky economics for a moment using these numbers but bear with me.

When a transit operator alters some aspect of a transit service, they of course also alter the ridership. Increase the vehicle speed and ridership goes up. Increase fares and ridership goes down. This is called the elasticity of demand: how much does a given change affect the demand for that transit service. The first example mentioned references the in-vehicle time elasticity because it indicates how much people change their habits based on how much time they spend in a vehicle. The second example is the price elasticity because it deals with the price of using the service.

Headways alter the access time elasticity, which is more valuable to people when it comes to transit. As much as you may enjoy your walk to the train, you probably enjoy the fact that you can work or sleep on the train en route a little bit more.

Access time elasticity among commuters is 1.28, which is pretty high. Decreasing average wait times by 1 percent by decreasing headways by 2 percent increases ridership by 128 percent [6]. Doubling SMART’s frequency to 15 minutes, then, will get us a 64 percent* increase in passengers: from 4,500 trips per day to about 7,380. Doubling frequency again could get us to 12,100 trips per day. This, of course, does not count the number of people who would use SMART for non-commute trips too, and it also ignores the effects of improving on the very infrequent service SMART is planning on providing in the middle of the day.

I would argue that a 15-minute frequency would absolutely be worthwhile on the basis of the commuters alone (the cost per new commute trip is $42,000, half the cost per trip on the baseline SMART system). A 7.5-minute system is not as cost-effective based on new commuters, but is significant if we include non-commute trips.

It may also be a viable alternative to a wider Novato Narrows. The traffic congestion there is in part due to a 15 percent increase in the number of cars travelling through to Central San Rafael, or roughly 500 more vehicles per hour [7]. Diverting 3,690 trips per rush hour (half of 7,380) would alleviate that congestion, at least until drivers fill up the space again thanks to induced demand [8].

So Hall is quite right on this point: transit frequency influences how people travel and how many people use the system. I am unsure whether he knew just how influential frequency can be, but no matter. SMART would do well to examine the effects of increasing its service frequency.

* Average wait times are half of the headway: if you arrive at a random point during the inter-train period, your average wait is half the full headway. Doubling frequency, then – a 100 percent increase – decreases average wait times by half that, or 50 percent.

Note: Given how off-topic any comments section can get in a SMART-focused article, I have turned them off for this post.

Works Cited

[1] Traffic in Marin, IJ Forums (San Rafael, CA, 2016).

[2] David Edmondson, “High SMART Frequency on the Cheap,” The Greater Marin, August 8, 2012.

[3] David Edmondson, “Can SMART Double-Track?,” The Greater Marin, August 6, 2012.

[4] Center for Economic Studies, “Longitudinal Employer-Household Dynamics” (United States Census, n.d.).

[5] Daniel G. Chatman et al., “Making Effective Fixed Guideway Transit Investments: Indicators of Success” (Washington, DC: Transportation Research Board, 2014).

[6] Arthur O’Sullivan, Urban Economics, 8th ed (New York, NY: McGraw-Hill/Irwin, 2012), 295.

[7] David Edmondson, “The 101 Corridor: Transportation Myopia in Practice,” The Greater Marin, January 13, 2013; Caltrans, “Traffic Volumes on California State Highways” (Sacramento, CA: Government of California, 2014).

[8] Connor Jones, “The Street Economics of Induced Demand,” The Greater Marin, December 21, 2015.

Supervisor races were all about geography

The June 7 primary election gave us political junkies a much-needed look at temperature of Marin County's electorate. In lieu of polls, it's easy to imagine the loudest voices are also the most politically powerful, but that doesn't seem to be the case this year. Instead, geography was destiny, with incumbents swinging to large victories in incorporated areas and challengers finding difficulty breaking out of their unincorporated enclaves. In West Marin, it was a classic case of North vs. South.

These maps were created using the First Count data released by the elections office on June 10. Full data counts won't be available until next week. A brief update will outline what changed once these data are released.

District 2: Katie Rice, Kevin Haroff, Frank Egger

Image by the author. Click to enlarge.

This election pitted incumbent Katie Rice against Larkspur councilmember Kevin Haroff and former Fairfax councilmember (now Ross Valley Sanitary District board member) Frank Egger. Haroff was endorsed by the Citizen Marin coalition and came out early against the Larkspur Station Area Plan. Egger orchestrated rezoning large chunks of downtown Fairfax to include more parking a few years ago and has called for more parking around Larkspur Landing.

First, Rice won every precinct and won the district with a whopping 57 percent. Nowhere did she earn fewer votes than her challengers. However, these two split the Citizen Marin vote, and there are areas where Rice won less than the combined totals of her challengers.

Rice was strongest in Gerstle Park, downtown San Rafael, and Larkspur, but would have likely lost Ross, Greenbrae, and northern Fairfax had she only faced one challenger. Egger was strongest in Fairfax, as he often is, but failed to make a good showing elsewhere. Haroff showed strongest in Ross and Greenbrae but did not do so well in his home city.

District 3: Kate Sears and Susan Kirsch

Image by the author. Click to enlarge.

Incumbent Kate Sears beat back a vigorous challenge from Citizen Marin co-founder Susan Kirsch who arguably started her campaign almost two years ago.

Strawberry vigorously pushed back against a then-years-old Priority Development Area, arguing it was a way for Sears to ram through new housing. Though that anger and resentment are largely in the past, its marks remain on this electoral stage, with Kirsch handily winning the Strawberry Peninsula and narrowly earning the support of nearby unincorporated neighborhoods on the Tiburon Peninsula.

Tam Valley/Homestead Valley/Almonte, home to Citizen Marin ally Sustainable TamAlmonte and numerous protests over Muir Woods tourists, however, went to Sears, as did all the incorporated towns in the district. Sears’ strongest support came from Marin City, possibly indicating that attempts to make inroads there by Kirsch and Community Venture Partners’ Bob Silvestri have not been terribly successful electorally. Sausalito, home to Citizen Marin allies and councilwomen Linda Pfeifer and Jill Hoffman, also went strongly for Sears.

District 4: The West Marin melee

Image by the author.

The chaotic 8-way race to replace Steven Kinsey resulted in a runoff between first-place Dennis Rodoni and second-place Dominic Grossi. No doubt the various endorsing bodies will be looking hard at the positions of both as progressive Wendi Kallins (frequently misspelled Wendy) and Citizen Marinite Al Dugan both failed to make the top two.

Rodoni, Grossi, and Kallins, along with 8th-place finisher Mari Tamburo, each claimed victory in at least one precinct. Rodoni’s support was concentrated in the urban areas of District 4, such as Larkspur and Novato; Grossi won the rural ranchlands of West Marin, as is befitting a rancher; and Kallins won her home of Forest Knolls, Olema, and San Geronimo. Dugan’s support, such as it was, came from East Marin, implying his platform of traffic and pension reform just don’t resonate out West.

EDIT: [A typo in my map reversed Rodoni and Grossi, which gives us an interesting chance at counterfactuals. Here's my alternative, corrected analysis:]

Rodoni, Grossi, and Kallins, along with 8th-place finisher Mari Tamburo, each claimed victory in at elast one precinct. Rodoni's support was concentrated in the township and urban areas of southern West and East Marin, including his home of Olema. Grossi won his home city of Novato and the more agriculturally-focused areas of northern West Marin, with just a few pockets of support in Southern Marin. In this first-round of results - we won't have the final vote tally until next week - Kallins won the central areas of West Marin in the San Geronimo Valley. Tam Valley was fairly evenly split.

Dugan support was strongly focused in East Marin, though he came in a distant fourth place. His support, such as it was, indicates his platform of traffic and pension reform just didn't resonate out West.

Intriguingly, Kallins seemed to be most in competition with Grossi, not Dugan, with a negative correlation between Grossi and Kallins vote shares. Dugan seems to have been a candidate on his own, with no clear negative correlation between his vote share and anyone else’s. He shares this in common with the other also-rans and Rodoni. This likely means that Grossi and Kallins split support. If Kallins supporters swing over to Grossi, he would be a formidible foe, able to command support of most of the incorporated areas of his district as well as the more populous pieces of West Marin. Rodoni would need to pick up not just Dugan supporters but many of the other also-rans to match. We will find out more as the Grossi and Rodoni campaigns gear up for the runoff in November.

If a pattern can be drawn, it is that Marinites reward competence and presence in their supervisors. District 4 residents rewarded supervisors with West Marin sensibilities. In Districts 2 and 3, their efforts or not, Kate Sears and Katie Rice have both been at the forefront of efforts to fix their districts' traffic. Yet this also cuts the other way: Strawberry and Greenbrae feel sidelined by their respective supervisors. Building trust will be difficult in these communities, but will be important: the superior organizing power of anger and aggrievement can make governing difficult even for an electorally safe politician.

Author's note: I am digitizing a huge amount of electoral data going back to 2013 for all races. If there is a race you would like to see mapped, let me know in the comments.

Author's other note: Unfortunately, Marin’s elections office does not keep shapefiles of electoral precincts, only lists of which residential properties belong to which precinct. This makes for unpleasant-looking maps, with holes and gaps where roads or uninhabited parcels are. But, short of redrawing hundreds of electoral precincts, it’s the best we have.

Citizen Marin slate loses big – what does it mean for their coalition?

In the aftermath of elections in three supervisorial races where incumbents prevailed handsomely and West Marin’s Al Dugan notched a dismal fourth place, behind progressive third-place finisher Wendi Kallins, it is worth asking whether the coalition that birthed them still has steam.

Citizen Marin and its coalition – Community Venture Partners, MAD, Larkspur Strikes Back, Citizens for Sustainable Pension Plans, and Sustainable TamAlmonte, among others – came to Marin in a splash back in 2011 and has notched up significant victories halting plans that would have allowed Marin’s affordable housing supply to expand in Strawberry, Tam Valley, Larkspur, Terra Linda, and Marinwood. They elected Damon Connolly to the Board of Supervisors and fought hard against new bicycle lanes, transit infrastructure, and zoning reforms throughout the county.

This year seemed like a golden chance for them to solidify a majority on the Board of Supervisors, allowing them to not just block reforms and homes but also entrench car-oriented policies and push against regional planning efforts from a position of power. In Kevin Haroff, they had a Larkspur councilmember; in Susan Kirsch, a longtime activist with name recognition; in Al Dugan, a resume sure to appeal to pension reformers.

They also had time. Talk of the supervisorial races was active in anti-housing circles as early as two years ago, with Susan Kirsch penning a coming-out Marin Voice in 2014.[1] They even felt confident enough to campaign against Measure AA, with Kirsch calling it taxation without representation.[2]

Yet each, sticking to the familiar talking points about housing, regionalism, and traffic, lost big, with incumbents Katie Rice and Kate Sears beating challengers by double-digit margins and Dugan not even notching above 10 percent.

In the absence of solid data, it’s tough to say exactly why the three failed, but it’s likely the anger that propelled the anti-housing coalition to prominence is subsiding in the population at large. Dick Spotswood, for what it’s worth, agrees, writing, “Much of America is angry. Not Marin.”[3]

Even if this is the case, housing advocates and other progressive reformers have only started to win a conversation set by Citizen Marin. They have yet to really start a new one. Supporting the progressive vision of Marin as a collection of welcoming, car-optional and quiet suburban towns is quite a different thing than just disbelieving Citizen Marin’s fearfulness.

And there are real problems that have languished as progressives have fought a drag-out fight for better affordable housing, especially the utter mismanagement of Golden Gate Transit.

There is no guarantee that the conversation will shift or that the coalition is on its way out. It still has elected supporters throughout Marin, and the upcoming Plan Bay Area meetings offer it an opportunity to reignite the anger that launched its march. Dick Spotswood still occupies a powerful soapbox. Yet the tide that nearly shifted Marin’s political landscape certainly feels as though it is ebbing. It simply remains to be seen whether the coalition will be able to launch another successful anti-incumbent challenge.

Works Cited

[1] Susan Kirsch, “Building on Voters’ Push for Political Affirmation,Marin Independent Journal, November 12, 2014.

[2] Susan Kirsch, “Bay Tax Is Taxation without Representation for Marin,” Marin Independent Journal, March 9, 2016.

[3] Dick Spotswood, “Marin Results Don’t Reflect Much Voter Anger,Marin Independent Journal, June 11, 2016.

Bad shuttle routing will make SMART's last-mile problem worse

Shuttle service to SMART’s temporary north end will be winding, slow, and inefficient. That’s bad news for Sonoma’s towns, which are already under strain from car commuting.

Waiting for the Bus. Image by Franck Michel, on Flickr.

Waiting for the Bus. Image by Franck Michel, on Flickr.

Sonoma County is getting passenger rail service for the first time in decades, hopefully starting at the tail end of 2016, with the opening of the SMART train.

SMART is starting to move from being an agency building a train, to an agency that will *run* a train. Big difference. Based on a lot of things I have heard in the past, there is concern that General Manager Farhad Mansourian is a better project manager CEO than an operations CEO. Time will tell, but as we approach the opening and decisions start to fall in place, I am going to reload this blog and follow the topic.

At last month's SMART board meeting, there was a presentation on First/Last Mile connectivity. The PDF is linked above, there is also avideo of this meeting - March 2, 2016 which is interesting and a bit illuminating. The board rightly gives the staff of SMART and the related agencies credit for a lot of hard work, but there are a lot of holes in the strategy which underscores that transit agencies and boards don't really focus test their ideas. They look at a problem, place themselves in the problem, and imagine how the problem needs to be solved. Witness Caltrain discussing workers who can go in "later" because they have "flexible" schedules. They go to work 8-5, my office doesn't even turn the lights on until 9 AM and people get upset at meetings before 10. The schedule isn't "flexible", it's flat out different.

With SMART, the board (mostly local politicians) and staff are working from a very "how do I get to San Francisco" mindset. I can't blame them, a lot of the public reacts this way as well, if you read internet comment boards. Officially, SMART diverges from this message on their website:

Today, more than 75% of commuters in the North Bay travel either within or between the two counties to get to work.

Thus we get to my first topic on the presentation on first/last mile - the North County Coordination to be provided by Sonoma County Transit. This connection is at the direction of the board and not negotiable - Windsor, Healdsburg, and Cloverdale were on the original proposed train line, and have had train service delayed indefinitely due to lack of funding. There is a bus from Cloverdale to Santa Rosa - route 60 - but it's slow compared to the freeway and doesn't go to the train depot on Airport Rd. SCT is going to add a shuttle - as seen in the first/last mile presentation, that will express between the 3 towns and the North SMART terminus at Airport Road. It will mostly run on US-101 in uncongested areas making it a quick connector. Sort of.

The proposed schedule shows the "go south in the AM, north in the PM" mindset of SMART. The only shuttles in the AM run North to South to meet trains, there are no proposed shuttles the opposite direction. One problem - the City of Healdsburg is a net *importer* of labor, not an exporter! SMART is trying to figure out how to get a small population of Healdsburg residents south, instead of the large population that is trying to get TO Healdsburg. The population shift during the day is such that tiny Healdsburg is starting to have parking wars and is now considering using valuable downtown land to build more parking.

Healdsburg has over 4,500 in-commuters and over 3,700 out-commuters. This relatively large shift in population for a town of just 11,000 during the workday is exacerbating housing and parking constraints.

Healdsburg has over 4,500 in-commuters and over 3,700 out-commuters. This relatively large shift in population for a town of just 11,000 during the workday is exacerbating housing and parking constraints.

Housing prices in Healdsburg are forcing the town's workforce to leave the city for Santa Rosa and Cloverdale, less expensive areas, which is bad on its own, but exacerbates the parking problem which leads to bad land use decisions which feedback to make the housing problem worse. That workforce could theoretically take SMART to the Airport and hop a shuttle to town, but it won't exist.

Not only does a northbound shuttle not exist, but the market of workers in Cloverdale who could take the shuttle to Healdsburg will be poorly served. The express shuttle will go from Cloverdale to Healdsburg in 20 minutes. SCT route 60 takes ~40 minutes to make the same run - the express cuts the trip in half and could attract new riders. However, because SMART and SCT are only thinking about "get people to the train" - the stop is located at the decrepit Healdsburg train depot on the outskirts of town (and they are building a $1 Million parking lot there), producing a walk for people making that trip which eats up any time savings. It also means that any tourists from SF who decide to take this route get dumped off in the middle of nowhere instead of the middle of town. Might as well drive. This in order to provide park and ride service to a bus for Healdsburg residents? The Healdsburg depot is out of the way for most Healdsburg residents, the bus will make an additional out of the way stop at the Windsor "Train Depot", before winding to Airport Road. Summary - any sane Healdsburger with a car will simply drive to the Airport Road Station.

The detour through HBG to get to the old depot, and the similar winding trip in Windsor kills the trip time, reducing any incentive for people coming from Cloverdale to use the shuttle. The buses should make quick stops just off the freeway but close to the downtowns - the Amtrak bus stop at Mill/HBG Ave in Healdsburg, and right off the freeway in Windsor next to where there is a McDonalds. Shuttle service like this relies on speed. Optimizing it is the only chance to get the ridership needed to keep the shuttle going and hopefully support the train. This includes understanding that some of the riders will eschew the train altogether, using the shuttle as a fast intra-North County bus service. And they should provide service in both directions at both peaks.

Original Post: Murphy, John. 2016. “SMART Train - Last Mile Connectivity - North County.” Holier than You Blog. March 31.

Other Works Cited

Healdsburg, CA. 2016. “Cerri Site (Purity Building) Redevelopment Project.Healdsburg, California Official Site. Accessed May 29.

Mason, Clark. 2015. “Mass Evictions in Healdsburg Prompt Cries of Racism.The Press Democrat, July 8.

Michel, Franck. 2014. Waiting for the Bus. Photograph.

Sonoma-Marin Area Rail Transit. 2016a. Board of Directors Meeting: March 4, 2016. Petaluma, CA.

———. 2016b. “First/Last Mile Connection.” Petaluma, CA, March 2.

U.S. Census Bureau. 2016. LODES Data. Longitudinal-Employer Household Dynamics Program.

Anti-urban groups fight to keep Drake congested

MAD: Fighting to make its logo a reality. Image from MAD. [1]

Despite years of arguing new housing will exacerbate traffic congestion and blaming the county’s urbanists for indifference to the problem of congestion, Marin Against Density (MAD) is now fighting against new traffic lanes on Sir Francis Drake (Drake), arguing the project will actually reduce capacity. Fact check: it won’t.

The project

Drake Boulevard is a mess south of Ross from every perspective. To people on foot or bike, it’s a hot, loud, dangerous traffic sewer. To people in cars, it’s a congested nightmare every rush hour. Thankfully, there’s enough space on the road to make the first problem a little less bad and fix the second problem.*

The biggest change to Drake would be a third lane heading south from Marin Catholic to 101 and, in one design, north from 101 to El Portal by narrowing lanes from between 15 and 21 feet to a standard 11 feet. This will increase capacity by about 50 percent along the most congestion stretches of the road, a huge boost for drivers that have complained about for years.

Other changes would be squaring off intersections in a few sections to make it safer to walk, new shoulders – formerly Class II bike lanes – and wider sidewalks [2]. Given that there are schools along the route, these are victories for parents and children along the way.

So what’s the problem?

According to an email from MAD [3], and to comments from anti-urbanists from the last time I tackled this problem in November [4], the primary complaint is that narrowing lanes will reduce capacity by slowing traffic. They’ve labelled it a traffic calming exercise, designed to support safety rather than traffic flow.

Even if we look past the morally reprehensible attitude that the safety of people walking isn’t worth protecting, it’s utterly illogical. MAD doesn’t understand how roads work.

A short primer on road capacity functions is in the notes, if you’re interested, but here’s the short of it: moving from a 12-foot lane to an 11-foot lane will decrease the free-flow speed of a road by about 3 percent, but adding a whole new lane will increase capacity much more than what’s lost by that very slight depression in free-flow speed. Add it all up, and the project should boost capacity by 45.5 percent.

But what about right-turn lanes lost? There is still more road capacity, so while the far right lanes might be slower during off-peak times, through drivers who won’t be in the far right lanes won’t need to worry.

To put it very simply, the county wants to slow uncongested travelers by about 3 percent to add 50 percent capacity. This seems like the kind of project MAD would support if it was so worried about traffic.

But MAD’s opposition to adding makes so little sense it boggles the mind. Why would an organization that argued any new homes will cause congestion fight against measures that might actually reduce congestion? The political answer might be the easiest.

It’s an election season, and that Fairfax email was rife with disparaging words for incumbent supervisor Katie Rice and glowing words for the conservative, Kevin Haroff, who has come out against the project [5]. By painting this redesign as a road diet rather than the road widening it is, MAD and its fellow organizations (CVP and Citizen Marin) can say that Rice has no solutions and is beholden to the madness of us urbanists.

If it’s about politics, then MAD is lying about the project to help their candidate and Haroff is complicit in the deception.

Of course, lots of anti-urbanists see a conspiracy to destroy Marin’s character. They probably actually believe that adding bike lanes is just part of that conspiracy. Al Dugan thinks I work for an anti-Marin lobbying group in DC, for instance.

So some people are playing the political game and don’t care if they’re on the technically correct side of a given issue or not as long as their candidate wins. Others want their candidate to win because they think only by cleaning house can they halt the spread of dangerous ideas in Marin. It’s a potent mix, and it‘s leading Marin down a dark path.

If even a project that will boost traffic capacity by nearly 50 percent is successfully painted as a congestion-causing project, there’s something seriously wrong with our politics. When we can’t even agree on what’s real or not, we cannot have a successful government. Fairfax went through this during Frank Egger’s years on the council. San Anselmo is going through its own turmoil with Ford Greene. Sausalito and Marinwood are going through phases when the whole governing body is dominated by people who take this sort of confrontational and personal approach to governing.

The Drake project has its problems, and I’ve highlighted them before, but as a symbol of our political dysfunction it is extremely worrying.

Notes

* For today, I’m not going to get into induced demand and the Fundamental Law of Traffic Congestion, which Connor Jones went over this past winter [6]. That’s a deeper problem, but fixing it is something nobody has the political stomach to take on even in San Francisco, let alone Marin.

Level of Service diagram, click to enlarge. Image from Wali Mamon.

** Traffic capacity – how many vehicles a road can carry in an hour – is a function of a road’s design speed and the road’s traffic jam density, or how many vehicles fit per mile when traffic speeds are basically zero:

Maximum Capacity = Number of Lanes × ((Free-flow Speed×Jam Density)/4)

This is called the Greenshields model, which is a reasonable tool for analyzing roads like this. Among other things, it tells us that as speed decreases, the number of cars the road can move per hour actually increases, at least up to a point. This is thanks to the fact that the space between cars decreases as speed decreases, allowing the road to be used more efficiently. Generally speaking, this is around Level of Service (LOS) grade E, though engineers try to keep LOS at around C or D to ensure some slack in the system [7].

According to this model, reducing the free-flow speed by 3 percent in this model to add a new lane will increase the maximum capacity by roughly 45.5 percent.

Works Cited

[1] Marin Against Density, MAD Logo, Digital Image, n.d.

[2] Kentfield Planning Advisory Board, “Sir Francis Drake Boulevard Corridor Rehabilitation” (Kentfield, CA, October 28, 2015).

[3] Marin Against Density, “Attend June 1 ‘Open House’ -- Forward This to Friends.,” June 1, 2016.

[4] David Edmondson, “Build Something Better on South Sir Francis Drake,” The Greater Marin, November 18, 2015.

[5] Issues,” Kevin Haroff for Supervisor District 2, accessed June 2, 2016.

[6] Connor Jones, “The Street Economics of Induced Demand,The Greater Marin, December 21, 2015; Connor Jones, “The Four Biggest Myths about Induced Demand,” The Greater Marin, January 4, 2016.

[7] Francis Vanek et al., Sustainable Transportation Systems Engineering: Evaluation & Implementation (New York: McGraw-Hill Education, 2014), chap. 7; Wali Memon, “Highway Level of Service,” October 12, 2012.

SMART Train alcohol policy comes up short

SMART wants to limit alcohol on its trains to only what patrons buy at the concessionaire. Experience from Caltrain shows that allowing riders to BYOB policy is not just good policy, but helps embed the system further into the culture of riders. 

Caltrain riders hanging out. Image from SF2G.com

Caltrain riders hanging out. Image from SF2G.com

For 18 years I have ridden Caltrain - and in that time I have brought aboard and consumed hundreds of bottles and cans of beers, which I have enjoyed legally on the train. This includes frequent patronage of the semi-official Party Car formed by the cyclists on Caltrain.

Starting in 2000, alcohol consumption on Caltrain increased exponentially with the opening of AT&T park, home of the San Francisco Giants. Giants fans have flocked to the train, riding up the Peninsula with cases of beer and bottles of who knows what, safely being carried to and from the games. At some point, Caltrain decided to ban alcohol on trains running after 9 PM only IF there is an event - primarily Giants games but also Sharks games, concerts at AT&T Park, and now 49ers games and concerts at Levi's Stadium. That late, the consumption before and during the events reach enough of a pitch that it was prudent to put a limit on the policy. Over the years the train has also served hugely alcohol-fueled events like Bay to Breakers, Hardly Strictly Bluegrass, Octoberfests, etc... frequently on the same day.

Generally speaking, this open BYOB policy on Caltrain has been a success. Problems are generally very rare, given the nature of the train as primarily a commuter rail with a higher level fare. It has been an attraction to the train that has a nominal positive influence on overall ridership numbers.

At the end of 2016, I will start riding a new train line - the SMART train in Sonoma County. It will function as primarily commuter rail, running almost exclusively during peak commute hours, with a fare structure prohibitive to general miscreants, making it nominally similar to Caltrain, except that it will serve no special events like the Giants as there are no major sports or entertainment venues on the train line.

SMART has released their draft code of conduct for the train. It includes a policy of NO BYOB. They don't have a no alcohol policy because they have an operating theorem of having a bar car on the train. I am very disappointed by this policy - I find it rider hostile and that it will have a negative impact on the rider experience and overall ridership. While there will be a bar car - there are bar cars on the Amtrak Capitol Corridor too, but in a place like Sonoma County with an excellent selection of beer and wine, to limit riders to the meager selection of a bar car is misguided.

There is, of course, the suspicion that the rationale is not to prevent unruly behavior, but to support whatever vendor they get for their bar car. This is understandable, for the most part because the decision to put a bar car onto the trains is misguided at best. SMART put out a presentation on the bar car where they are toying with giving free rent to the vendor for a return of a percentage of the profits. This is predicated on the presumption that a bar car will turn a profit - my experience from the Amtrak Capitols is that the bar car is at best a loss leader, not a profit center. This is especially true when you consider that SMART has wasted valuable train space to build the bar car.

I personally think that the potential ridership of SMART should make it clear that the no BYOB policy is not in line with the overall goals of the train. They should reconsider this path and allow riders to bring their own beverages onto the train.

If you agree - please email SMART at info@sonomamarintrain.org.

Originally Published: Murphy, John. 2016. “SMART Train Alcohol Policy.” Holier than You Blog. May 18.

Source: http://holierthanyou.blogspot.com/2016/05/...